Unit 2 · Topic 2.5 · about 30 minutes · 7 parts · 14 scored checks, 3 of them multiple choice
AP Human Geography 2.5: The Demographic Transition Model
Unit 2: 12 to 17% of the multiple-choice section
What you'll be able to do
- Explain theories of population growth and decline: use the demographic transition model to explain how a country's birth rate, death rate and growth change over time, and the epidemiological transition to explain why its death rate falls.
Key vocabulary
| Term | What it means | The exam trap |
|---|---|---|
| Demographic transition model | A model of how a country's birth rate, death rate and population growth change over time, in five stages. | Stage 5 was added after the original model, so some books and maps show only four stages. |
| Crude death rate | The number of deaths per 1,000 people in a year. | It counts deaths against the whole population, so the age of the population matters. |
| Epidemiological transition | The shift in a population's main causes of death, from infectious and parasitic diseases to chronic diseases, as lives grow longer. | It explains changes in the death rate, so do not use it alone to explain a falling birth rate. |
| Infectious disease | A disease spread by germs such as bacteria, viruses or parasites, often through unsafe water, insects or contact with sick people. | Parasitic diseases, such as malaria, are grouped with infectious ones in this model. |
| Chronic disease | A long-lasting disease, such as heart disease, cancer or stroke, that develops over years and is most common in older people. | Some books call these degenerative diseases; the two names mean the same thing here. |
| Zero population growth | A population that neither grows nor shrinks, because births plus immigrants equal deaths plus emigrants. | Reaching a replacement-level fertility rate does not bring it at once; a young population keeps growing for decades. |
 Tap to open the picture full size
Part 1 Think first Which rate falls first?
Commit to a guess first. Being wrong now makes the right idea stick better.
Predict first
Around 1850, a hypothetical farming country had about 40 births and 38 deaths per 1,000 people each year. Over the next century it built roads and clean water systems, new medicines arrived, and people moved to cities. Which rate do you expect fell first?
In short. The demographic transition model describes how a country's birth rate, death rate and population growth change over time in five stages, and the epidemiological transition explains the falling death rate by the shift in what people die of, from infectious to chronic disease.
- Stage 1 has high birth and death rates and slow growth; in Stage 2 the death rate falls while births stay high, so growth is fastest; in Stage 3 the birth rate falls and growth slows.
- In Stage 4 both rates are low and growth is slow; in a Stage 5 that some countries have reached, births fall below deaths and the population shrinks.
- As clean water, vaccines and medicine bring infectious disease under control, people live longer and die mostly of chronic diseases such as heart disease and cancer.
Part 2 Learn it Two transitions
2a. Stages 1 and 2: the death rate falls
The demographic transition model (DTM) follows a country's crude birth rate and crude death rate over time, through five stages. It was built from the history of countries in Western Europe and North America, where the change took about two centuries.
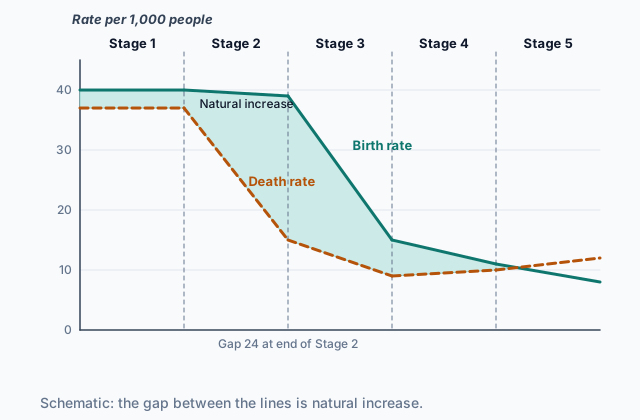
In Stage 1 both rates are high, near 40 per 1,000, and the death rate jumps in years of famine or epidemic. Births and deaths nearly cancel, so the population grows slowly. Most people farm. No country is in Stage 1 today.
In Stage 2 the death rate falls fast. Better harvests and food storage, clean water, sewers and, later, vaccines keep more people alive, children above all. The birth rate stays high, because families still want and expect many children. The gap between the two rates is now wide, and the population grows faster than in any other stage.
 Tap to open the picture full size
Quick check · Fill the statement
Complete the description of hypothetical Country F as it moves from the first stage of the model into the second.
In 1800, before Country F had sewers, clean water or vaccines, its birth rate and death rate were both , so its population grew slowly. After it built sewers and clean water systems, its rate fell, and its population grew .
2b. Stages 3, 4 and 5: the birth rate falls
In Stage 3 the birth rate falls too. As more people work in factories and offices and live in cities, children cost more to raise and add less to family income. Most children now survive, so families no longer need many births to be sure some grow up. More girls stay in school, and contraception is easier to get. The gap narrows and growth slows, though the population still rises.
In Stage 4 both rates are low, near 10 per 1,000, and close to each other. Growth is slow, close to zero.
Some countries have moved into a Stage 5, which was not part of the original model. The birth rate drops below the death rate, and the population shrinks and ages unless immigrants make up the difference. The death rate even rises a little, because a larger share of the people are old.
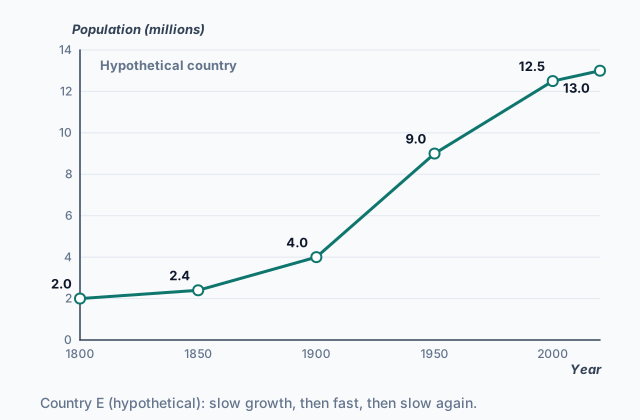
The picture at the top of the page shows the result for hypothetical Country E: slow growth at first, fast growth in the middle, and slow growth again at the end.
Quick check · Put it in order
Put these events in hypothetical Country G's history in the order the demographic transition model describes them.
2c. Using the model, and where it falls short
Read a country's stage from both rates, never from one. A death rate of 8 per 1,000 fits Stage 3 or Stage 4; the birth rate tells you which. A birth rate of 35 with a death rate of 9 is Stage 2: deaths have fallen and births have not.
The model explains a lot. It shows why countries whose death rates fell in the twentieth century grew so fast, and why countries with low birth rates now grow slowly or shrink. But it has limits.
- It was built from the history of a few industrialized countries. Many countries passed through Stage 2 in decades, not a century, because they could adopt medicine already developed elsewhere.
- It does not say how long a stage lasts. A country can stay in Stage 2 or 3 for a long time if its birth rate stays high.
- It leaves out migration, which for some countries changes the population more than births and deaths do.
- It assumes the birth rate falls as a country industrializes, but religion, culture and government policy shape birth rates too.
Quick check · Decide and justify
Hypothetical Country J cut its death rate from 30 to 10 per 1,000 in about 25 years by adopting vaccines and antibiotics from abroad, while its birth rate stayed high. In the countries the model was built from, a drop like that took more than a century. Does Country J's history mean the demographic transition model cannot describe it?
Which reason supports your answer?
2d. The epidemiological transition
The epidemiological transition explains why death rates change, by following the shift in what people die of. It is usually told in stages that line up with the DTM.
- Pestilence and famine. Infectious and parasitic diseases, failed harvests and childbirth kill many people young, and life expectancy is low. This matches DTM Stage 1.
- Receding pandemics. Clean water, sewers, better diets and, later, vaccines and antibiotics cut deaths from diseases such as cholera and measles. The death rate falls fast, as in DTM Stage 2.
- Degenerative and human-created diseases. With infections under control, more people live long enough to die of chronic diseases, such as heart disease, cancer and stroke. This matches DTM Stage 3.
- Delayed degenerative diseases. Medicine and healthier habits push those deaths to later ages, and life expectancy keeps rising. This matches DTM Stage 4.
Some geographers add a fifth stage, the reemergence of infectious and parasitic diseases, as germs that resist antibiotics and new viruses spread through a closely connected world.
Quick check · Match
Match each stage of the epidemiological transition to what a hypothetical country's health records show.
Part 3 Watch it done Place a country on the model
Watch each step, then do the last one yourself.
Hypothetical Country H recorded these rates per 1,000 people. In 1960: birth rate 46, death rate 22. In 1990: birth rate 43, death rate 11. In 2020: birth rate 26, death rate 7. Find its rate of natural increase in each year, and use the pattern to place it on the model.
Predict first
Before the steps, which stage do you expect Country H to be in by 2020?
Step 1 · 1960
46 minus 22 is 24 per 1,000, a rate of natural increase of 2.4 percent. The death rate is well below Stage 1 levels while births stay high: Stage 2.
Step 2 · 1990
43 minus 11 is 32 per 1,000, or 3.2 percent. The death rate has halved and the birth rate has barely moved, so the population grows faster than in 1960. It is still Stage 2, near its end.
Why this step?
Why did growth speed up between 1960 and 1990, even though the birth rate fell a little?
The death rate fell by 11 points and the birth rate by only 3, so the gap between them widened. Growth depends on the gap, not on either rate alone.
Your step · Calculate
Finish it. What was Country H's rate of natural increase in 2020, as a percent?
%
Part 4 Try it Use the model to plan
Try it · Sort it
Each card describes a change in a hypothetical country. Tap a card, then the rate it lowers first.
Lowers the death rate
Lowers the birth rate
Try it · Decide and justify
Hypothetical Country L has a birth rate of 39 and a death rate of 12 per 1,000, and both have held steady for several years. Its planners must decide what to build most of over the next 20 years.
Which reason supports your answer?
Part 5 Explain it Explain a country's transition
Nothing you type leaves this page. Check your answer against the model and each scoring point.
Free response is 50% of the exam score. This one is shaped like Question 1, from free-response II.
Free-response practice · Question 1 style
Answer each part about the demographic transition model and the epidemiological transition.
(A) Identify the stage of the demographic transition model in which a country's population grows fastest.
(B) Describe how the death rate changes between Stage 1 and Stage 2.
(C) Explain one reason the death rate falls in Stage 2, using the epidemiological transition.
(D) Explain one economic reason the birth rate falls in Stage 3.
(E) Describe how the leading causes of death change as a country moves from Stage 2 to Stage 4.
(F) Explain one way a country in Stage 5 could keep its population from shrinking.
(G) Explain one limitation of the demographic transition model for predicting the future of a country that is in Stage 2 today.
Model answer
(A) Stage 2, when the gap between the birth rate and the death rate is widest.
(B) The death rate falls sharply from the high level of Stage 1, while the birth rate stays high.
(C) In the stage of receding pandemics, clean water and sewers stop diseases such as cholera that spread through dirty water, and vaccines prevent childhood diseases, so fewer people, children above all, die of infection.
(D) As people move to cities and work in factories and offices, children no longer earn money for the family and cost more to house and educate, so couples choose fewer children.
(E) Infectious and parasitic diseases cause fewer deaths, and chronic diseases, such as heart disease and cancer, become the leading causes, because more people live long enough to get them.
(F) It could admit more immigrants, who add people directly and are often young adults who go on to have children. (A policy that pays or encourages families to have more children is another way.)
(G) The model does not say how long a stage lasts. A Stage 2 country's birth rate may stay high for decades because of religion, culture or government policy, so the model cannot say when its growth will slow.
Score your own answer. This is a self-check, not a grade. Tick each point your answer makes.
Part 6 Check yourself Four countries on the model
The case questions use the table. The others mix the ideas from the whole lesson.
A hypothetical health report compares four countries. The rates are per 1,000 people per year.
| Country | Crude birth rate | Crude death rate | Life expectancy (years) | Leading cause of death |
|---|---|---|---|---|
| W | 22 | 7 | 72 | Heart disease |
| X | 8 | 12 | 84 | Cancer |
| Y | 41 | 13 | 58 | Diarrheal disease |
| Z | 10 | 9 | 81 | Heart disease |
Case question 1 · Multiple choice
Which country is most likely in Stage 3 of the demographic transition model?
Case question 2 · Decide and justify
Countries X and Y have nearly the same death rate. Use the table to decide what best explains Country X's death rate.
Which reason supports your answer?
Case question 3 · Multiple choice
Country Y's leading cause of death is diarrheal disease, an infection spread mostly through unsafe water, while Country W's is heart disease. Which explanation fits the epidemiological transition?
The rest stand on their own and do not use the case.
Check yourself · Spot the error
A student places hypothetical Country K on the demographic transition model. Which line is the first to go wrong?
Check yourself · Select all
Which two are limitations of the demographic transition model? Select two.
Select 2 answers, then check.
Part 7 Keep it Bring back earlier ideas
This lesson stands on doubling time from Topic 2.4 and carrying capacity from Topic 2.2.
Bring it back · Multiple choice
Hypothetical Country S has a crude birth rate of 23 and a crude death rate of 9 per 1,000. Using the rule of 70, about how long would its population take to double?
Bring it back · Fill the statement
A hypothetical valley and its water.
The valley's wells, soil and pasture can support about 50,000 people over the long run without being used up. That number is the valley's . Its population has grown to 70,000, so over the coming years the level of water in its wells will .
In three lines
- Demographic transition model: high rates and slow growth (1), the death rate falls and growth is fastest (2), the birth rate falls (3), low rates (4), births below deaths (5).
- Epidemiological transition: deaths shift from infectious and parasitic diseases to chronic diseases as clean water, vaccines and medicine lengthen lives.
- Read a stage from both rates together, and remember the model gives an order of change, not a timetable, and leaves out migration.
Exam strategy for this topic
- Section I, Multiple Choice: 60 questions in 60 minutes.
- Section II, Free Response: 3 questions in 75 minutes.
Name a stage only after comparing the birth rate with the death rate. When a question asks why a death rate fell, answer with a cause the epidemiological transition names, such as clean water or vaccines, and tie it to fewer deaths from infection.
Questions students ask
How many stages does the demographic transition model have?
The original model had four. Most current textbooks add a fifth, in which the birth rate falls below the death rate and the population shrinks, because some countries have reached it.
Does every country move through every stage?
The model describes the path countries in Western Europe and North America took. Many countries have followed the same order of changes, often much faster, but nothing makes a country leave Stage 2 or Stage 3 on a schedule.
Why does the death rate rise a little in Stage 5?
Health care is still good, but a larger share of the people are old, and older people die at higher rates. The crude death rate counts deaths against the whole population, so it rises as the population ages.
How do the demographic transition model and the epidemiological transition fit together?
The demographic transition model shows what happens to birth and death rates. The epidemiological transition explains the death rate part: the falling death rate of Stage 2 comes from controlling infectious disease, and the low death rate of later stages comes with chronic disease at older ages.
Are the countries in this lesson real?
No. Every country here is hypothetical, with rates chosen to show each stage clearly. Real countries move between stages gradually and do not always fit one neatly.
Course alignment, for teachers
AP Human Geography topic 2.5, Unit 2: Population and Migration Patterns and Processes.
- Skill 3.B: Describe spatial patterns presented in maps and in quantitative and geospatial data.
This lesson maps all 2 essential knowledge statements of the topic to the part that teaches each one: 2 are checked by a scored question. The map is in the lesson file.