Unit 2 · Topic 2.8 · about 30 minutes · 7 parts · 14 scored checks, 3 of them multiple choice
AP Human Geography 2.8: Women and Demographic Change
Unit 2: 12 to 17% of the multiple-choice section
What you'll be able to do
- Explain how changes in women's lives, in schooling, work, health care, contraception, social values and political rights, change fertility, mortality and migration in different parts of the world.
Key vocabulary
| Term | What it means | The exam trap |
|---|---|---|
| Total fertility rate | The average number of children a woman would have over her lifetime at the current birth rates for each age. | It counts children per woman, not births per 1,000 people, which is the crude birth rate. |
| Contraception | Methods that let people prevent pregnancy, so couples can choose how many children to have and when. | Access depends on cost, law and who decides, not only on whether clinics exist. |
| Maternal mortality | Deaths of women from causes related to pregnancy and childbirth. | It is about mothers, not infants; infant deaths are a separate measure. |
| Opportunity cost | What a person gives up to make a choice, such as the wages lost while out of work to raise a child. | It is a cost even when no money is spent. |
| Ravenstein's laws of migration | Patterns E. G. Ravenstein found in British migration data in the 1880s, such as most migrants moving short distances and young adults moving most often. | Ravenstein wrote several laws, so name the one about women and men when a question asks about them. |
| Sex ratio | The number of males for every 100 females in a population or group. | The ratio for one group, such as recent migrants, can differ greatly from the ratio for the whole population. |
 Tap to open the picture full size
Part 1 Think first Two villages, one goal
Commit to a guess first. Being wrong now makes the right idea stick better.
Predict first
In hypothetical Village A, one child in three dies before age 5. In nearby Village B, a new clinic means almost every child lives to grow up. Couples in both villages want about three children to reach adulthood. Which village is likely to have more births per woman?
In short. As women gain schooling, paid work, health care and contraception, fertility falls, deaths in childbirth fall, and women migrate farther and more often on their own.
- Health care raises child survival, so families need fewer births for the number of grown children they want, and contraception lets couples have only the children they want.
- Schooling delays marriage and first births, paid work makes each extra child cost more in lost wages, and changing values shrink the family people see as ideal.
- Ravenstein found that women moved more often than men but over short distances; as women's economic and political roles change, more women move long distances on their own.
Part 2 Learn it How women's lives shape births, deaths and moves
2a. Health care and contraception
Fertility here means the average number of children a woman has, measured by the total fertility rate. In most of the world it has fallen sharply, and changes in women's lives sit behind much of the fall.
Start with health care. Where many children die young, families have extra births to be sure some children grow up to work, marry and care for their parents in old age. Vaccines, clean water, prenatal care and clinics raise child survival, so fewer births give the same number of grown children. Couples adjust, usually after a delay: death rates fall first, and birth rates follow.
The arithmetic: if one child in five dies before age 5, four of every five births survive. Two grown children then take 2 ÷ 0.8 = 2.5 births on average. When almost every child survives, two births give about two grown children.
Contraception is the other half. Modern contraception lets couples choose how many children to have and when, so a fall in the number of children people want becomes a fall in births. Access depends on clinics, cost and law, and on whether a woman can decide for herself to use it.
Quick check · Calculate
In hypothetical Village C, one child in four dies before age 5, and every child who reaches 5 grows up. A couple wants three children to reach adulthood. On average, how many births does that take?
2b. School, work and changing values
Schooling for girls is one of the strongest links to lower fertility. A girl who stays in school to 18 usually marries and has her first child later, which leaves fewer years for having children. She is also more likely to know about contraception and to want fewer children, each given a longer and costlier education.
Paid work adds an opportunity cost: each year out of a job to raise a child means wages and promotions given up. The better paid the job, the more each extra child costs.
Social values shift at the same time. Where children worked on the family farm and were their parents' only support in old age, a large family made sense. In a city with pensions and savings, children cost money for many years and earn none, and the family people describe as ideal shrinks.
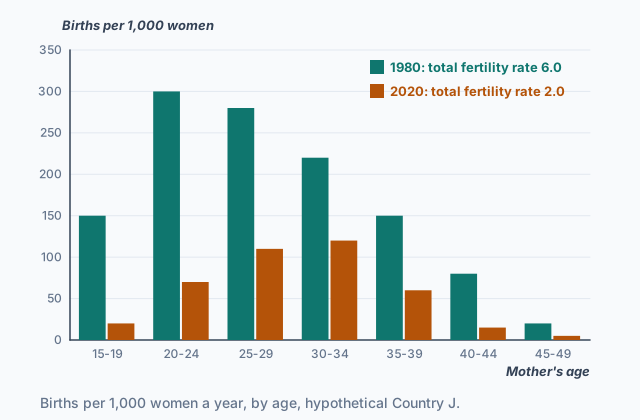
The chart at the top of the page shows the result in hypothetical Country J. In 1980 births peaked among women aged 20 to 24; by 2020 the peak was among women aged 30 to 34, and every age group had fewer births. The total fertility rate fell from 6.0 to 2.0.
Quick check · Match
Each change happened in a hypothetical country. Match it to the way it lowers fertility.
2c. Women's roles and death rates
Changing roles for women change death rates as well as birth rates.
Maternal mortality is deaths of women from pregnancy and childbirth. It falls when women have fewer pregnancies, start them after their teens rather than during them, and give birth with a trained health worker present. A law that raises the age of marriage, more years in school and nearby clinics push all three in the same direction.
Children gain too. Mothers with more schooling get their children vaccinated more often, recognize illness sooner and seek care earlier, so child deaths fall where girls' education rises. Women who earn their own income tend to spend much of it on their children's food and health.
Where girls marry young and give birth without trained help, many women die in their teens and twenties. As those risks fall, women's life expectancy rises, and fewer children grow up without a mother.
Quick check · Select all
In hypothetical Country M, most girls now finish secondary school and marry after age 20. Which two changes in death rates are likely to follow? Select two.
Select 2 answers, then check.
2d. Women's roles and migration
In the 1880s E. G. Ravenstein studied migration records in Britain and wrote a set of laws of migration, patterns he found in the data. Most migrants moved short distances, often in steps from village to town to city. Long-distance migrants headed for big cities. Most were young adults. And women were more likely than men to migrate within their own country, mostly over short distances, while men more often moved long distances and abroad.
That pattern fit women's roles at the time. Many young women moved to a nearby town for work as servants or in textile mills, while long journeys for work in mines, ports or new lands were treated as men's work.
As women's economic and political roles changed, so did the pattern. Where women can work for wages, own property, hold a passport and travel without a male relative's permission, many move long distances for jobs on their own: as nurses, caregivers, factory workers and students. So Ravenstein's pattern for men and women fits today's moves less well than it fit his own data.
Quick check · Sort it
Each card describes a hypothetical migration. Tap a card, then whether it fits Ravenstein's pattern for women and men or departs from it.
Fits Ravenstein's pattern
Departs from it
Part 3 Watch it done Who moves near and who moves far?
Watch each step, then do the last one yourself.
Hypothetical City R surveyed everyone who moved there last year. From villages in the same province came 12,000 women and 8,000 men. From other countries came 3,000 women and 6,000 men. Find the sex ratio, men per 100 women, for each group, and say whether the city's newcomers fit Ravenstein's pattern.
Predict first
Before the steps: in which group do you expect women to outnumber men?
Step 1 · Write the sex ratio
Sex ratio = men ÷ women × 100. A ratio below 100 means more women than men; above 100, more men.
Step 2 · Newcomers from nearby villages
8,000 ÷ 12,000 × 100 = about 67. There are about 67 men for every 100 women, so women outnumber men on the short moves.
Why this step?
Why compare men per 100 women instead of the raw counts?
The two groups are different sizes, 20,000 and 9,000 people. A ratio puts both on the same scale, so you can compare the balance of men and women directly.
Your step · Calculate
Finish it. What is the sex ratio, men per 100 women, of the newcomers from other countries?
men per 100 women
Part 4 Try it Predict from women's lives
Try it · Decide and justify
Hypothetical Country S passes laws that let women hold their own passports and sign job contracts without a male relative's permission. Over the next 20 years, will women's share of the people leaving Country S to work abroad most likely rise or fall?
Which reason supports your answer?
Try it · Rank it
Four hypothetical regions of one country have about the same average income. Rank them by their likely total fertility rate.
Lowest fertility first
Give each one a place, 1 for first. Give two the same place if they are equal.
Your ranking: none yet
Part 5 Explain it Explain a country's demographic change
Nothing you type leaves this page. Check your answer against the model and each scoring point.
Free response is 50% of the exam score. This one is shaped like Question 1, from free-response II.
Free-response practice · Question 1 style
Over 40 years in hypothetical Country T, the share of girls finishing secondary school rose from 20 percent to 80 percent, a law raised the minimum age of marriage to 18, clinics opened in most towns, and women gained the right to work and travel abroad without a male relative's permission.
(A) Identify the most likely change in Country T's total fertility rate over the 40 years.
(B) Describe how more years of school for girls affect the age at which women have their first child.
(C) Explain how women's paid work lowers fertility.
(D) Explain how better health care for children can lower the number of births per woman.
(E) Explain one way these changes affect deaths of women from pregnancy and childbirth.
(F) Describe the pattern of women's migration in Ravenstein's laws.
(G) Explain how the new right to work and travel abroad could change the migration of women from Country T.
Model answer
(A) It fell.
(B) Girls who stay in school longer marry and have their first child later, often in their twenties rather than their teens.
(C) A woman with a paid job gives up wages and chances for promotion for each year she spends out of work raising a child. That opportunity cost makes each extra child more expensive, so families choose fewer.
(D) When more children survive to adulthood, parents need fewer births to end up with the number of grown children they want, so births per woman fall.
(E) Fewer pregnancies, no births in the early teens, and births in clinics with trained health workers all lower the risk of dying in childbirth, so maternal deaths fall.
(F) Ravenstein found women more likely than men to migrate within their own country, mostly over short distances, while men more often moved long distances and abroad.
(G) Women no longer need a man's permission to leave or to take a job, so more women will migrate abroad on their own for work, and women's share of long-distance migrants will rise.
Score your own answer. This is a self-check, not a grade. Tick each point your answer makes.
Part 6 Check yourself Forty years in Country N
The case questions use the table. The others mix the ideas from the whole lesson.
A national survey in hypothetical Country N recorded the same measures every 20 years.
| Year | Girls finishing secondary school | Women in paid work | Births with a trained health worker | Average age at first birth | Total fertility rate |
|---|---|---|---|---|---|
| 1985 | 20% | 15% | 30% | 18 | 6.0 |
| 2005 | 55% | 35% | 70% | 22 | 3.6 |
| 2025 | 85% | 50% | 95% | 27 | 1.9 |
Case question 1 · Multiple choice
Which statement best describes the pattern in the table?
Case question 2 · Calculate
By what percent did Country N's total fertility rate fall from 1985 to 2025? Round to one decimal place.
Case question 3 · Multiple choice
If the trends in the table continue to 2045, which change in Country N is most likely?
The rest stand on their own and do not use the case.
Check yourself · Spot the error
A student explains why fertility will fall in hypothetical Country T. Which line is the first to go wrong?
Check yourself · Fill the statement
Complete the description of a new law in a hypothetical country.
Hypothetical Country S lets women hold passports and sign job contracts without a male relative's permission. That is a change in women's role, and it most directly changes patterns of .
Part 7 Keep it Bring back earlier ideas
This lesson stands on population policies from Topic 2.7 and the demographic transition model from Topic 2.5.
Bring it back · Multiple choice
Hypothetical Country Y offers a payment for each third child and expands free day care. Which kind of policy is this, and what is its intent?
Bring it back · Match
Match each stage of the demographic transition model to the change in population it describes.
In three lines
- Health care raises child survival and contraception lets couples choose, so fewer births are needed and fewer happen.
- Schooling delays first births, paid work raises the cost of each child, and changing values shrink the ideal family.
- Women's changing roles lower deaths in childbirth and let more women migrate long distances, departing from Ravenstein's pattern.
Exam strategy for this topic
- Section I, Multiple Choice: 60 questions in 60 minutes.
- Section II, Free Response: 3 questions in 75 minutes.
When a question asks how women's changing roles affect a population, name the change (schooling, paid work, health care, contraception, rights) and then the demographic result it leads to: fewer or later births, fewer deaths in childbirth, or more women migrating.
Questions students ask
Does contraception alone lower fertility?
It lets couples act on the family size they want. If schooling, work and values still favor large families, contraception changes less; where people want fewer children, it turns that wish into fewer births.
Why does child health care lower births instead of raising them?
When most children survive, parents need fewer births to raise the number of children they want, so births per woman fall, usually a generation or so after child deaths fall.
Do Ravenstein's laws still hold?
Some patterns, such as most moves being short and most migrants being young adults, still appear in many places. His finding that men made most long moves holds less well, because women now migrate long distances for work on their own.
Is women's education the same as women's employment in these questions?
No. Schooling mainly changes timing and knowledge: later marriage, later first births, more use of contraception. Paid work mainly changes cost: each child means more wages given up.
Are the countries and villages in this lesson real?
No. Every country, village and city here is hypothetical, with numbers chosen to show each idea clearly. Real places show these changes at different speeds.
Course alignment, for teachers
AP Human Geography topic 2.8, Unit 2: Population and Migration Patterns and Processes.
- Skill 3.B: Describe spatial patterns presented in maps and in quantitative and geospatial data.
This lesson maps all 2 essential knowledge statements of the topic to the part that teaches each one: 2 are checked by a scored question. The map is in the lesson file.