Unit 2 · Topic 2.9 · about 30 minutes · 7 parts · 14 scored checks, 3 of them multiple choice
AP Human Geography 2.9: Aging Populations
Unit 2: 12 to 17% of the multiple-choice section
What you'll be able to do
- Explain how birth rates, death rates and life expectancy make a population older, and the political, social and economic consequences of an aging population, using the dependency ratio.
Key vocabulary
| Term | What it means | The exam trap |
|---|---|---|
| Aging population | A population whose median age is rising and whose share of people 65 and older is growing. | A population can age while it is still growing in size. |
| Life expectancy | The average number of years a newborn is expected to live at current death rates. | It is an average from birth, so it is not the age at which most people die. |
| Dependency ratio | The number of people under 15 and 65 and older for every 100 people aged 15 to 64. | The age cutoffs, 15 and 65, are conventions, and some sources use other ages. |
| Old-age dependency ratio | The number of people 65 and older for every 100 people aged 15 to 64. | Say which ratio you mean, since the two can move in opposite directions. |
| Pension | A regular payment to a person after retirement, often paid by the government from taxes on current workers. | Some pensions are paid from savings instead, which changes how much aging strains them. |
| Median age | The age that divides a population into two halves, one older and one younger. | It can rise even while the number of children stays the same, if the older groups grow. |
 Tap to open the picture full size
Part 1 Think first Which country grows older?
Commit to a guess first. Being wrong now makes the right idea stick better.
Predict first
Two hypothetical countries start with the same number of people and the same mix of ages. Over 30 years, Country A's birth rate falls by more than half while life expectancy stays at 70. Country B's birth rate stays high while life expectancy rises from 70 to 78. After 30 years, which country has the older population?
In short. A population ages when birth rates fall and people live longer, and an older population changes what a country must pay for, who cares for whom, and how people vote.
- Falling birth rates make each new group of children smaller, and falling death rates at older ages and longer life expectancy add people at the top, so the median age rises.
- The dependency ratio counts people under 15 and 65 and older for every 100 people aged 15 to 64; the old-age dependency ratio counts only those 65 and older.
- Aging strains pensions and health care, shifts demand toward elder care, puts more care work on families, and gives older voters more weight in politics.
Part 2 Learn it How populations age, and what follows
2a. Why populations age
A population is aging when its median age rises and people 65 and older become a larger share of it. Birth rates, death rates and life expectancy decide it.
- Falling birth rates usually do the most. Each year's group of babies is smaller than the one before, so the base of the population pyramid narrows and every older group becomes a larger share.
- Falling death rates at older ages, and the longer life expectancy that comes with them, add people at the top: more people reach 65, and they live longer after it.
A falling death rate does not always age a population. Early in the demographic transition, most of the lives saved are children's, which makes a population younger at first. It starts to age once birth rates fall too.
Migration matters too: most migrants are young adults, so a region that loses them ages faster.
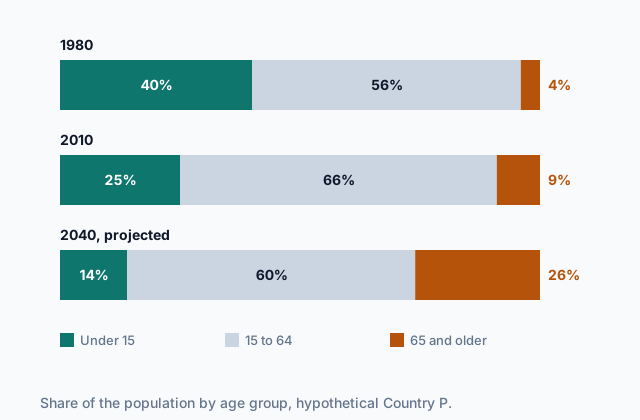
In hypothetical Country P, in the chart at the top of the page, the share 65 and older grows from 4 to 26 percent while the share under 15 falls from 40 to 14 percent.
Quick check · Sort it
Each card is a change in a hypothetical country or region. Tap a card, then what it does to the age of that population.
Makes the population older
Makes the population younger
2b. The dependency ratio
The dependency ratio compares the people most likely to need support with the people of working age:
dependency ratio = (people aged 0 to 14 + people aged 65 and older) ÷ people aged 15 to 64 × 100
It gives the number of dependents for every 100 people of working age. The old-age dependency ratio puts only the people 65 and older on top.
Take Country P from the chart. In 1980: (40 + 4) ÷ 56 × 100 = about 79. In 2040: (14 + 26) ÷ 60 × 100 = about 67. The ratio is lower in 2040, but its dependents are mostly old instead of mostly young: the old-age ratio rises from about 7 to about 43.
The mix matters. Children need schools; older people draw pensions and need more health care and long-term care, and pensions and health care are among the largest items in many government budgets. So two countries with the same dependency ratio can face very different bills.
The ratio is also rough. Many people aged 15 to 64 are in school or out of work, and many people over 65 still work.
Quick check · Calculate
Hypothetical Country K has 3,000,000 people aged 0 to 14, 12,000,000 aged 15 to 64 and 3,000,000 aged 65 and older. What is its dependency ratio?
2c. Economic and social consequences
An aging population changes what a country needs and who pays for it.
- Pensions and health care. Many countries pay pensions and health care for older people from taxes on today's workers. As the old-age dependency ratio rises, each worker supports more retirees, so governments raise taxes, cut benefits or both.
- Workers. When large groups retire and smaller groups replace them, employers struggle to fill jobs, and the economy can grow more slowly.
- What people buy. Demand shifts away from schools, maternity wards and baby goods toward clinics, home care, nursing homes and housing built for older people.
- Families. More care for aging parents falls on adult children, often daughters, who may cut back paid work to give it. Grandparents who stay healthy longer also care for grandchildren.
- Places. Villages that lose their young adults are left mostly older, and their schools and shops close.
Quick check · Match
Each change is happening in an aging hypothetical country. Match it to its most likely result.
2d. Political consequences
Aging changes politics as well. Older people vote at high rates, and in an aging country they become a larger share of voters. Proposals to cut pensions or health care for older people are hard to pass, and public spending can shift from schools toward older people.
Governments respond to aging in several common ways:
- raising the retirement age, which keeps people working and paying taxes longer and is usually unpopular
- pronatalist policies to encourage births, which take about 20 years to add workers
- admitting more young immigrants, which adds workers quickly and often sets off political debate
- encouraging more women and older people to work for pay
Each choice has winners and losers by age, so aging can set younger and older voters against each other on budgets, taxes and immigration.
Quick check · Fill the statement
Complete the description of an aging hypothetical country's politics.
Older voters in hypothetical Country Z turn out at high rates, so proposals to pensions rarely pass. To keep its pension system paid for without them, the government instead .
Part 3 Watch it done Work out an aging country's ratios
Watch each step, then do the last one yourself.
In 2050, hypothetical Country Q is projected to have 1,400,000 people aged 0 to 14, 5,600,000 aged 15 to 64 and 2,800,000 aged 65 and older. Find its dependency ratio and its old-age dependency ratio.
Predict first
Before the steps: will Country Q have more dependents than working-age people, fewer, or about the same number?
Step 1 · Add the dependents
People aged 0 to 14 plus people 65 and older: 1,400,000 + 2,800,000 = 4,200,000.
Step 2 · Divide by the working-age group
4,200,000 ÷ 5,600,000 × 100 = 75. Country Q has 75 dependents for every 100 people aged 15 to 64, so fewer dependents than working-age people, but not by much.
Why this step?
Why work out the old-age ratio as well, once you have the dependency ratio?
The total hides the mix. Two-thirds of Country Q's dependents are 65 and older, and they need pensions and health care rather than schools, so the old-age ratio says more about the bills ahead.
Your step · Calculate
Finish it. Now count only the people 65 and older. What is Country Q's old-age dependency ratio in 2050, the number of people 65 and older for every 100 people aged 15 to 64?
per 100 working-age people
Part 4 Try it Plan for an older country
Try it · Decide and justify
Hypothetical Country V's old-age dependency ratio is projected to rise from 25 to 50 over the next 30 years. Its pensions are paid from taxes on current workers, and leaders want to keep paying them without raising tax rates. Which policy helps sooner?
Which reason supports your answer?
Try it · Rank it
Rank these hypothetical countries by their dependency ratio. Work out each ratio from the shares before you rank.
Highest dependency ratio first
Give each one a place, 1 for first. Give two the same place if they are equal.
Your ranking: none yet
Part 5 Explain it Explain an aging country's future
Nothing you type leaves this page. Check your answer against the model and each scoring point.
Free response is 50% of the exam score. This one is shaped like Question 2, from free-response II.
Free-response practice · Question 2 style
A census of hypothetical Country H found that in 2000, 30 percent of its people were under 15, 62 percent were 15 to 64 and 8 percent were 65 and older. Its projection for 2040 is 15 percent, 57 percent and 28 percent. Over the same years, its total fertility rate falls from 2.3 to 1.4, and life expectancy rises from 74 to 82.
(A) Identify the age group whose share of Country H's population is projected to grow from 2000 to 2040.
(B) Describe how the change in the total fertility rate contributes to the change in Country H's age structure.
(C) Describe how the change in life expectancy contributes to it.
(D) Explain one economic consequence of the change for Country H's government.
(E) Explain one social consequence of the change for Country H's families.
(F) Explain one political consequence of the change.
(G) Explain one limitation of the dependency ratio as a measure of how many people depend on those of working age.
Model answer
(A) People 65 and older, from 8 percent to 28 percent.
(B) A total fertility rate falling to 1.4, below replacement, means each new group of children is smaller than the one before. The share under 15 shrinks, from 30 to 15 percent, so older groups make up more of the population.
(C) Rising life expectancy means more people reach 65 and live longer after it, which adds people at the top of the age structure.
(D) Pensions and health care for older people are paid largely from taxes on workers. With more older people for each worker, the government must raise taxes, cut benefits or raise the retirement age.
(E) More adult children, often daughters, care for aging parents, and some cut back paid work to do it.
(F) Older voters become a larger share of the electorate, which makes cuts to pensions hard to pass and can set younger and older voters against each other over taxes and spending.
(G) It assumes everyone aged 15 to 64 works and no one 65 or older does. Many younger adults are in school or out of work, and many older people keep working.
Score your own answer. This is a self-check, not a grade. Tick each point your answer makes.
Part 6 Check yourself Country R grows older
The case questions use the table. The others mix the ideas from the whole lesson.
Hypothetical Country R's statistics office publishes its population by age group, with a projection for 2050.
| Year | Aged 0 to 14 | Aged 15 to 64 | Aged 65 and older | Total fertility rate | Life expectancy |
|---|---|---|---|---|---|
| 2000 | 6.0 | 12.0 | 2.0 | 2.4 | 72 |
| 2025 | 4.0 | 13.0 | 3.5 | 1.5 | 78 |
| 2050, projected | 3.0 | 10.5 | 6.3 | 1.4 | 83 |
Case question 1 · Multiple choice
Which statement best explains why Country R's population is aging?
Case question 2 · Calculate
What is Country R's projected old-age dependency ratio in 2050, the number of people 65 and older for every 100 people aged 15 to 64?
Case question 3 · Multiple choice
Which consequence is most likely in Country R by 2050?
The rest stand on their own and do not use the case.
Check yourself · Spot the error
A student uses the dependency ratio to plan a hypothetical country's budget. Which line is the first to go wrong?
Check yourself · Select all
Which two are political consequences of an aging population? Select two.
Select 2 answers, then check.
Part 7 Keep it Bring back earlier ideas
This lesson stands on women and demographic change from Topic 2.8 and population pyramids from Topic 2.3.
Bring it back · Multiple choice
Hypothetical Country T opens clinics that sharply cut child deaths, and it offers free contraception. Which outcome is most likely over the next 20 years?
Bring it back · Fill the statement
Read a hypothetical country's population pyramid.
A population pyramid that is narrower at the base than in the middle, with wide bars for ages 50 and older, shows a population that is . A company planning for the next 20 years there would expect a growing market for .
In three lines
- Populations age when birth rates fall and older people live longer; early falls in death rates save mostly children and make a population younger.
- Dependency ratio: people under 15 and 65 and older, per 100 people aged 15 to 64; split it into young and old to see the needs.
- Aging strains pensions and health care, changes what people buy, adds family care work, and gives older voters more weight.
Exam strategy for this topic
- Section I, Multiple Choice: 60 questions in 60 minutes.
- Section II, Free Response: 3 questions in 75 minutes.
When a question asks why a population is aging, name the birth rate first and then life expectancy, and say which end of the age structure each one changes. When it asks about consequences, say whether each is political, social or economic, as the question asks.
Questions students ask
Is the dependency ratio the same as the old-age dependency ratio?
No. The dependency ratio counts children under 15 and people 65 and older; the old-age ratio counts only people 65 and older. As a country ages the first can fall while the second rises.
Do lower death rates always make a population older?
No. When death rates first fall, most of the lives saved are children's, which makes a population younger. Lower death rates at older ages make it older.
Can a growing population be aging?
Yes. A population can keep growing from population momentum or immigration while its median age rises and its share of people 65 and older grows.
Why do aging countries argue about immigration?
Immigrants are mostly young adults, so admitting more adds workers and taxpayers quickly. Whether to do so is a political choice, and people disagree about it.
Are the countries in this lesson real?
No. Every country here is hypothetical, with numbers chosen to show each idea clearly. Real countries age at different speeds and for different mixes of reasons.
Course alignment, for teachers
AP Human Geography topic 2.9, Unit 2: Population and Migration Patterns and Processes.
- Skill 2.C: Explain a likely outcome in a geographic scenario using geographic concepts, processes, models, or theories.
This lesson maps all 2 essential knowledge statements of the topic to the part that teaches each one: 2 are checked by a scored question. The map is in the lesson file.