Unit 6 · Topic 6.10 · about 30 minutes · 7 parts · 12 scored checks, 3 of them multiple choice, plus 2 from earlier lessons
AP Human Geography 6.10: Challenges of Urban Changes
Unit 6: 12 to 17% of the multiple-choice section
What you'll be able to do
- Explain the causes and effects of change inside cities: the economic and social challenges that follow when people move within a city, the growth of squatter settlements and land tenure conflicts, the good and bad results of urban renewal and gentrification, responses such as inclusionary zoning and local food movements, and why governments split across many levels and places struggle to solve these problems.
Key vocabulary
| Term | What it means | The exam trap |
|---|---|---|
| Housing discrimination | Treating people unequally in buying, renting or borrowing for a home because of their race, ethnicity or other group identity. | It covers renting and lending as well as buying, and it can be carried out by many different actors. |
| Redlining | A lending practice in which banks and lending maps marked neighborhoods as too risky, often because of the race or ethnicity of the people living there, and denied them mortgages and repair loans. | The practice has ended, but its effects on homeownership and wealth can still be seen in a city's neighborhoods. |
| Blockbusting | A real estate practice in which agents stirred fear that a racial or ethnic minority group was moving onto a block, bought homes cheaply from panicked owners and resold them at a profit. | It depended on fear, not on any real change in the houses, so name who profited and how. |
| Housing affordability | Whether households can pay for housing; a common guideline counts housing that takes more than 30% of a household's income as a burden. | It depends on income as well as cost, so the same rent can be affordable for one household and a burden for another. |
| Access to services | How easily residents can reach stores, clinics, schools, banks and transit. | It is measured by the trip a resident actually makes, so cutting a bus route can lower access even when nothing else moves. |
| Environmental injustice | The unequal burden of pollution and environmental hazards on lower-income people and minority groups. | The facilities involved often serve a whole city or region, while their harm stays close to home. |
| Disamenity zone, or zone of abandonment | A very poor part of a city that people and investment have largely left, with vacant buildings, closed businesses or contaminated land. | Its problems feed one another, so such an area rarely recovers without outside investment. |
| Squatter settlement | Housing that people build on land they do not own or rent, often without water lines, sewers or paved roads. | Settlements often sit on land no one else wanted, such as steep slopes or floodplains, which adds physical hazards to the other risks. |
| Land tenure | The legal right to hold and use a piece of land. | It can belong to a person, a family, a community or a government, under formal or informal rules. |
| Inclusionary zoning | A local rule requiring new housing developments above a set size to include a share of units priced for lower- or middle-income households. | It shapes what gets built from now on, so it does not lower the rent of homes that already stand. |
| Local food movement | Efforts to grow, sell and buy food near where people live, through community gardens, urban farms, farmers markets and food from nearby farms. | It can start in wealthy neighborhoods as well as poor ones, so do not read it as a sign of either. |
| Urban renewal | A government program that buys and clears areas it judges run-down and rebuilds them, often with offices, highways, public housing or stadiums. | The name tells you who led the change, a government, as well as what changed. |
| Gentrification | Reinvestment in a run-down neighborhood in which higher-income residents move in, buildings are repaired and housing costs rise. | It can happen block by block, with no single plan or agency behind it. |
| Functional and geographic fragmentation | The way government agencies and institutions in a metropolitan area are dispersed between state, county, city and neighborhood levels: split by task among many agencies (functional) and split by place among many local governments (geographic). | It describes how power is divided, not how much money any one government has. |
 Tap to open the picture full size
Part 1 Think first Who is left when the neighbors leave?
Commit to a guess first. Being wrong now makes the right idea stick better.
Predict first
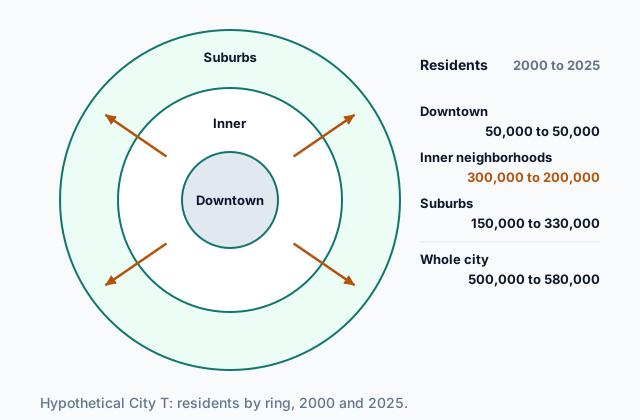
In hypothetical City T, the inner neighborhoods lost a third of their residents between 2000 and 2025 as families moved to new suburbs. The families who left had higher incomes, on average, than the ones who stayed. What is most likely to happen to the supermarkets and bank branches in the inner neighborhoods?
In short. When people move within a city, economic and social challenges follow, and they fall hardest on the residents left behind; the responses, from inclusionary zoning and local food movements to urban renewal and gentrification, each help some people and cost others.
- Redlining denied loans to whole neighborhoods and blockbusting used fear to turn over who lived on a block; affordability is whether a household can pay for housing at all.
- Lost access to services, rising crime, environmental injustice and disamenity zones, or zones of abandonment, follow people and money leaving, and squatter settlements and land tenure conflicts have grown in large cities.
- Inclusionary zoning and local food movements respond to these challenges, urban renewal and gentrification have both positive and negative consequences, and fragmented governments make shared problems hard to solve.
Part 2 Learn it Challenges of a changing city, and the responses
2a. Housing, discrimination and affordability
Moving within a city starts with who can move where. Housing discrimination is treating people unequally in buying, renting or borrowing for a home because of who they are. Two practices shaped many cities in the United States in the 1900s.
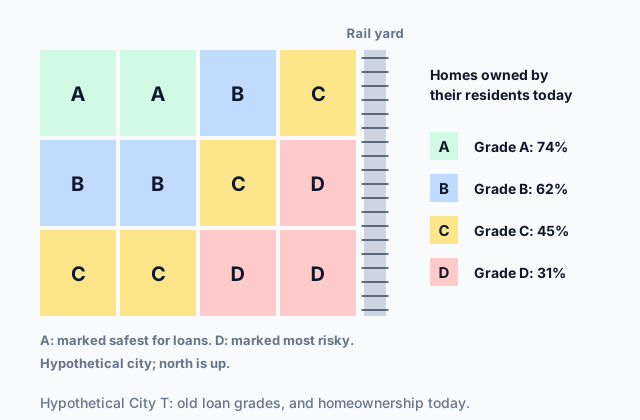
Redlining was a lending practice. Banks and lending maps graded neighborhoods by risk, and neighborhoods where Black residents or immigrants lived were often given the worst grade and denied mortgages and repair loans. With no loans, families could not buy, and homes decayed.
Blockbusting was a real estate practice. Agents told white homeowners that Black families were moving onto their block and that home values would crash, bought the houses cheaply from frightened owners, and resold them at higher prices to Black families shut out of other neighborhoods.
Both are illegal in the United States today, but their effects last, as the hypothetical map below shows.
 Tap to open the picture full size
Affordability is a separate problem: whether a household can pay for housing at all. A common guideline counts a household as cost-burdened when housing takes more than 30% of its income. When rents rise faster than wages, affordability gets worse for every household whose pay has not kept up, whether or not anyone treated it unfairly.
Quick check · Sort it
Each card describes a housing problem in a hypothetical city. Tap a card, then the term it shows.
Redlining
Blockbusting
Affordability problem
2b. Services, safety and the places left behind
Residents with more money who move outward take their spending and taxes with them. The neighborhoods they leave lose stores, clinics, bank branches and bus routes, so the people who stay have less access to services. Empty buildings and fewer people on the street can bring rising crime, which pushes more residents and businesses away.
Hazards land unevenly too. Environmental injustice is when lower-income people or minority groups carry more than their share of pollution and hazards, such as a waste plant, a highway or a factory beside their homes. Residents with less money and power are less able to block a facility or move away.
At the extreme, a district becomes a disamenity zone, also called a zone of abandonment: an area so poor, polluted or unsafe that people and investment leave it, with vacant houses, closed factories and contaminated land.
In many large cities, especially fast-growing ones in developing countries, newcomers who cannot afford housing build on land they do not own. These squatter settlements have grown, and so have conflicts over land tenure, the legal right to hold and use land. Without title, families can be evicted after decades and rarely get water lines, sewers or paved roads.
Quick check · Multiple choice
In a hypothetical city, a district along an old rail line has two thirds fewer residents than in 1990. Home values there have fallen by half, lenders turn down loans for the district, and its empty lots are used for illegal dumping. Which term best names this district?
2c. Urban renewal and gentrification
Two kinds of change bring money back into run-down areas.
Urban renewal is a government program that buys and clears an area it judges run-down, then rebuilds it, often with offices, highways, public housing or a stadium. Gentrification is reinvestment in a run-down neighborhood, mostly by private buyers, in which higher-income residents move in, repair homes and open businesses, and housing costs rise. Urban renewal is led by a government; gentrification is a change in who lives in a neighborhood.
Both have positive and negative consequences.
- Positive: new or repaired buildings, fewer vacant lots, new stores and jobs, higher property values, and more tax revenue for city services.
- Negative: rents and property taxes rise, long-time renters and small businesses are priced out and displaced, and a neighborhood's community and culture can break apart. Many urban renewal projects of the mid-1900s cleared whole neighborhoods of low-income and minority residents, who were moved with little help.
The gains and the costs often land on different people. A city can collect more taxes and add jobs while the families who lived on the cleared blocks end up worse off. When you judge a project, ask who gained and who paid.
Quick check · Sort it
Each card describes a result of urban renewal or gentrification in a hypothetical city. Tap a card, then whether it is a positive or a negative consequence.
Positive consequence
Negative consequence
2d. Responses, and who has to carry them out
Two responses are worth knowing by name.
Inclusionary zoning is a local rule requiring new housing developments, usually above a set size, to include a share of units priced for lower- or middle-income households, or to pay into a fund that builds them. It keeps some affordable homes in neighborhoods where costs are rising.
Local food movements are efforts to grow, sell and buy food close to where people live: community gardens, urban farms, farmers markets and stores that sell food from nearby farms. They can bring fresh food back to a neighborhood that lost its supermarket.
Who carries out a response is its own challenge. Government in a metropolitan area is dispersed between state, county, city and neighborhood levels. In functional fragmentation, separate agencies each run one service: a transit authority, a water district, a school district, a housing agency. In geographic fragmentation, one metropolitan area is split among many governments, a central city, dozens of suburbs and several counties, each with its own rules. Urban problems cross these lines: a bus system can stop at a city limit, or a suburb can refuse the apartments the region needs, and no one government can fix the whole problem.
Quick check · Fill the statement
Complete the description of three events in hypothetical City V.
City V adopts a rule that every new building of 20 or more apartments must rent some of its units at prices lower-income households can pay. This response is . Neighbors turn a vacant lot into a vegetable garden and start a Saturday market for food grown in the county, which shows at work. A plan for one bus line across the metro area stalls because the central city's council and the councils of its eight suburbs must all approve it, a problem of .
Part 3 Watch it done Can she still afford the rent?
Watch each step, then do the last one yourself.
In hypothetical City V, a home health aide earns $54,000 a year. A renewal project opens near her apartment, and over five years her rent rises from $1,125 a month to $1,800 a month. Using the common 30% guideline, find the share of her income that goes to rent before and after the rise.
Predict first
Before the steps, where do you expect her rent to land after the rise?
Step 1 · Put both numbers on the same time scale
Her income is yearly and her rent is monthly, so turn the rent into a yearly amount first. Before the rise: $1,125 × 12 = $13,500 a year.
Step 2 · Find the share before the rise
$13,500 ÷ $54,000 = 0.25, or 25%. That is under 30%, so before the rise she was not cost-burdened.
Why this step?
Why turn the rent into a yearly amount before dividing?
A share only means something when both numbers cover the same period. Dividing a monthly rent by a yearly income would make almost every household look as if it spent only a few percent on housing.
Your step · Calculate
Finish it. After the rise, her rent is $1,800 a month and her income is still $54,000 a year. What percent of her yearly income goes to rent?
%
Part 4 Try it Respond to a changing city
Try it · Calculate
Hypothetical City V's inclusionary zoning rule requires 15% of the units in any new building of 20 or more units to be priced as affordable housing. A developer plans three buildings: one with 240 units, one with 120 units and one with 16 units. How many affordable units does the rule require across the three buildings?
Try it · Decide and justify
Hypothetical Metro Area W has a central city and 14 suburbs, each with its own council and zoning rules, and a regional transit authority run by the state. Many central-city residents cannot reach new warehouse jobs in the outer suburbs, because the city's buses stop at the city limit. The central city's council votes to run its own bus routes out to the warehouses. Can the council's vote alone get those buses running?
Which reason supports your answer?
Part 5 Explain it Explain the challenges of a changing city
Nothing you type leaves this page. Check your answer against the model and each scoring point.
Free response is 50% of the exam score. This one is shaped like Question 3, from free-response II.
Free-response practice · Question 3 style
Stimulus 1, a hypothetical map: Metro Area W has a central city ringed by 12 suburbs, each with its own council and zoning rules. A former rail yard on the central city's riverfront is marked "vacant, contaminated." The riverfront district around it is shaded to show vacant houses and closed businesses. The neighborhoods next to the rail yard are labeled with the grade a lender map gave them decades ago, D, most risky, and a note says they have the lowest median household income in the central city today.
Stimulus 2, hypothetical data for the central city: median monthly rent rose from $850 in 2010 to $1,450 in 2025. Over the same years, the share of renter households spending more than 30% of their income on rent rose from 32% to 51%.
(A) Identify the type of urban area the riverfront district around the former rail yard in Stimulus 1 shows.
(B) Describe the change in housing affordability shown in Stimulus 2.
(C) Explain how redlining could help explain why the neighborhoods next to the rail yard have lower incomes today.
(D) Explain one way gentrification of central-city neighborhoods could produce the change shown in Stimulus 2.
(E) The city plans to clear the rail yard and build offices and apartments there. Explain one negative consequence this urban renewal project could have for residents of the nearby neighborhoods.
(F) Explain how inclusionary zoning could respond to the change shown in Stimulus 2.
(G) Using Stimulus 1, explain how geographic fragmentation of government makes housing affordability harder to address across Metro Area W.
Model answer
(A) A disamenity zone, also called a zone of abandonment: a riverfront district of vacant, contaminated land, empty houses and closed businesses that people and investment have left.
(B) Housing became much less affordable. Median rent rose by $600 a month, and the share of renter households paying more than 30% of their income on rent rose from about a third to about half.
(C) Redlining graded these neighborhoods as most risky, so banks denied their residents mortgages and repair loans. Families there could not buy homes or build wealth through owning them, and the homes decayed, so lower incomes and less wealth were passed down to the people who live there now.
(D) Higher-income residents move into run-down central-city neighborhoods, repair homes and open businesses. Demand for housing there rises, so landlords raise rents faster than long-time residents' wages grow, and more renter households pass the 30% line.
(E) New offices and apartments could raise land values and rents in the neighborhoods next to the rail yard, so long-time renters and small businesses there could be priced out and displaced.
(F) Inclusionary zoning would require new developments, such as the apartments planned for the rail yard, to set aside a share of units at prices lower-income households can pay, so some affordable homes stay in the central city as rents rise.
(G) Each of the 12 suburbs makes its own zoning rules, and no one government controls housing across the metro area. A suburb can refuse apartments or affordable units, so the central city's rule cannot add affordable housing outside its own limits, and lower-income households end up concentrated in the central city.
Score your own answer. This is a self-check, not a grade. Tick each point your answer makes.
Part 6 Check yourself Four neighborhoods of City V
The case questions use the map and the table. The others mix the ideas from the whole lesson.
Hypothetical City V's planning office compared four of its neighborhoods. The map shows where they sit, and the table gives the numbers, all invented for this case. The city placed the three facilities on the map between 2008 and 2016.
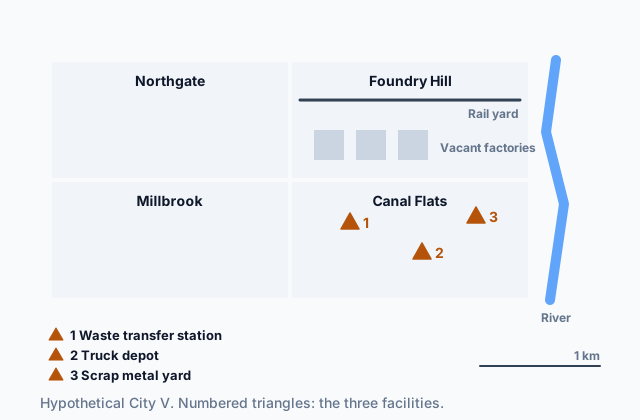 Tap to open the picture full size
| Neighborhood | Residents | Median monthly rent | Median household income |
|---|---|---|---|
| Northgate | 18,000 to 17,600 | $900 to $1,080 | $52,000 to $61,000 |
| Foundry Hill | 22,000 to 9,000 | $650 to $600 | $34,000 to $30,000 |
| Millbrook | 15,000 to 16,200 | $800 to $1,360 | $40,000 to $82,000 |
| Canal Flats | 20,000 to 19,400 | $700 to $780 | $31,000 to $29,000 |
Case question 1 · Multiple choice
Which neighborhood's changes from 2005 to 2025 best fit gentrification?
Case question 2 · Calculate
By what percent did Foundry Hill's number of residents fall from 2005 to 2025? Round to the nearest whole percent.
Case question 3 · Multiple choice
Which conclusion about environmental injustice do the map and the table best support?
The rest stand on their own and do not use the case.
Check yourself · Spot the error
A student judges an old project in hypothetical City S. Which line is the first to go wrong?
Check yourself · Match
Each observation comes from a different hypothetical city. Match each challenge to the observation that shows it.
Part 7 Keep it Bring back earlier ideas
This lesson stands on urban data from Topic 6.9 and urban sustainability from Topic 6.8.
From 6.9 Urban Data · Fill the statement
A census counted 600 residents aged 65 and older among 4,000 people in a neighborhood of a hypothetical city. Ten years later, the next census counted 600 residents aged 65 and older among 6,000 people there. Complete the description.
Between the two censuses, the number of residents aged 65 and older , and their share of the neighborhood's population . At the second census, that share was .
From 6.8 Urban Sustainability · Sort it
Each card describes an outcome after a hypothetical city adopted an urban design initiative. Tap a card, then say whether it supports praise for the initiative or a criticism of it.
Supports praise
Supports a criticism
In three lines
- Housing: redlining and blockbusting were discrimination whose effects last, and affordability is whether a household can pay for housing at all.
- As people and money move, lost services, crime, environmental injustice, zones of abandonment and squatter settlements fall on those left behind.
- Responses such as inclusionary zoning, local food movements, urban renewal and gentrification help some and cost others, and fragmented governments slow them.
Exam strategy for this topic
- Section I, Multiple Choice: 60 questions in 60 minutes.
- Section II, Free Response: 3 questions in 75 minutes.
When a question names an urban challenge, say who moved, who stayed and why the challenge falls on the people who stayed. When it asks about urban renewal or gentrification, give one consequence for the people who gained and one for the people who paid.
Questions students ask
What is the difference between redlining and blockbusting?
Both were forms of housing discrimination. Redlining was done by lenders, who denied mortgages and repair loans to whole neighborhoods. Blockbusting was done by real estate agents, who used fear of a new group moving in to buy homes cheaply and resell them at a profit.
Is gentrification good or bad?
It has both positive and negative consequences. Repaired buildings, new businesses and more tax revenue are gains; rising rents, displaced long-time residents and a lost sense of community are costs. A strong answer names who gains and who pays.
Are a disamenity zone and a zone of abandonment the same thing?
They name the same kind of place: a very poor part of a city that people and investment have left, with vacant buildings and often polluted land. Either term is fine; use the one the question uses.
Why does fragmented government make urban problems harder?
Problems such as housing costs, transit and pollution cross the lines between agencies and between cities, suburbs and counties. When each government controls only its own piece, no one government can fix the whole problem, and they have to agree first.
Are the cities and neighborhoods in this lesson real?
No. Every city, neighborhood and number here is hypothetical, chosen to show each challenge clearly. Redlining, blockbusting and urban renewal are real history in the United States, but the maps and figures that show them here are invented.
Course alignment, for teachers
AP Human Geography topic 6.10, Unit 6: Cities and Urban Land-Use Patterns and Processes.
- Skill 4.E: Explain how maps, images, and landscapes illustrate or relate to geographic principles, processes, and outcomes.
This lesson maps all 5 essential knowledge statements of the topic to the part that teaches each one: 5 are checked by a scored question. The map is in the lesson file.