Unit 6 · Topic 6.9 · about 30 minutes · 7 parts · 12 scored checks, 3 of them multiple choice, plus 2 from earlier lessons
AP Human Geography 6.9: Urban Data
Unit 6: 12 to 17% of the multiple-choice section
What you'll be able to do
- Explain how numbers from censuses and surveys, and descriptions from field studies and personal accounts, are used to show the causes and effects of change inside a city.
Key vocabulary
| Term | What it means | The exam trap |
|---|---|---|
| Quantitative data | Information recorded as numbers, such as counts, measurements and percentages, that can be compared and mapped. | Check what each number counts, the whole population or one group, before you compare two numbers. |
| Census | An official count of every person in an area, taken by a government at set intervals, that also records traits such as age and household type. | Its counts are taken years apart, so it shows change between two counts, not from one month to the next. |
| Survey | A set of questions asked of a sample, a group of people chosen to stand for a larger population. | Check how many people were asked and how they were chosen before you trust a share it reports. |
| Population composition | The makeup of a population by traits such as age, sex, ethnicity, household type and income. | Read each group as a share of the total as well as a count before you describe a change. |
| Qualitative data | Information recorded as words, images or observations rather than counts, such as an interview or a photograph. | Say whose words or which observations the data record, and where and when they were gathered. |
| Field study | Research done in the place itself: observing, photographing, mapping and talking with the people there. | Note where and when it was done, since it describes one place at one time. |
| Narrative | A person's own account of events and experiences, such as an oral history, a letter or testimony at a public meeting. | Note whose account it is, a long-time resident or a newcomer, before you use it. |
 Tap to open the picture full size
Part 1 Think first Growing or emptying out?
Commit to a guess first. Being wrong now makes the right idea stick better.
Predict first
A city report says the population of Eastgate, a neighborhood in a hypothetical city, rose by 20% between two censuses taken ten years apart. At a public meeting the same month, several residents who have lived in Eastgate for decades say the neighborhood is emptying out and that most of their old neighbors have moved away. Which conclusion fits both pieces of information?
In short. Urban data come in two kinds: quantitative data from censuses and surveys show how the size and composition of a city's population change, and qualitative data from field studies and narratives show how individual people feel about those changes.
- A census counts everyone in an area at set intervals, and a survey asks a sample; both give numbers that measure how many people live in a place and who they are.
- Field studies and narratives record what people see, say and feel in their own words, so they show individual attitudes toward a change, though not how widespread those attitudes are.
- Used together, the numbers measure what changed and where, and the words help explain why it happened and what it means to the people living through it.
Part 2 Learn it Two kinds of urban data
2a. Census and survey data: counting people
Quantitative data are information recorded as numbers: counts, measurements and percentages that can be compared and mapped. Two sources give most of the numbers about a city's people.
A census is an official count of every person in an area, taken by a government at set intervals, in many countries every ten years. It reports how many people live in each small area, such as a census tract, and records facts about them, such as age, household type and whether a home is rented or owned.
A survey asks questions of a sample, a smaller group chosen to stand for a whole population. It can be done between censuses, and it can ask things a census does not, such as how long people have lived at their address.
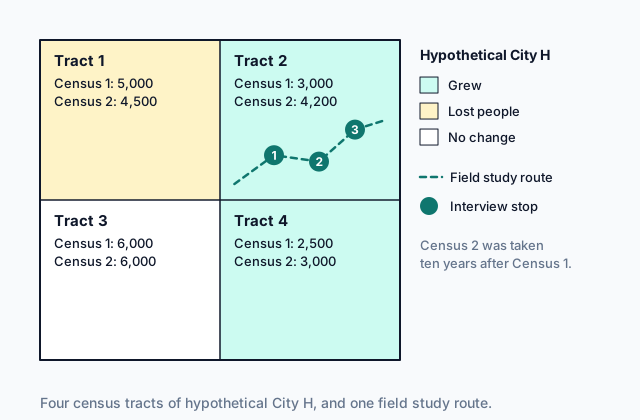
Comparing two censuses shows how the size of an urban population changed. In the map at the top of the page, Tract 2 of hypothetical City H grew from 3,000 to 4,200 people. The change is 4,200 minus 3,000, or 1,200 people. As a percent of the earlier count, that is 1,200 ÷ 3,000 × 100 = 40% growth. Always divide by the earlier count: the change is measured from where the tract started.
Quick check · Calculate
A census counted 12,500 people in a neighborhood of a hypothetical city. The next census, ten years later, counted 10,000 people there. By what percent did the neighborhood's population fall?
2b. Population composition: who lives there
Census and survey data also show changes in population composition, the makeup of a population by traits such as age, sex, ethnicity, household type and income. To read a change in composition, turn each group's count into a share of the total at each census: the group's count ÷ the total × 100.
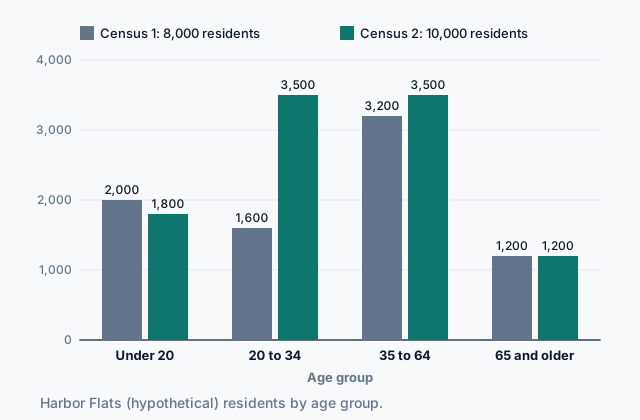
Shares matter because the total changes too. The chart shows hypothetical Harbor Flats, which grew from 8,000 to 10,000 residents.
 Tap to open the picture full size
Residents aged 20 to 34 rose from 1,600 to 3,500, and from 20% of the neighborhood to 35%. Residents aged 65 and older stayed at 1,200, yet their share fell from 15% to 12%, because the rest of the population grew around them. A difference between two shares is given in percentage points: the 20 to 34 group gained 15 percentage points.
Numbers like these show what changed. A jump in young adults can point to a cause, such as new apartments or new jobs nearby, but the census does not record why anyone moved.
Quick check · Fill the statement
A census counted 600 residents aged 65 and older among 4,000 people in a neighborhood of a hypothetical city. Ten years later, the next census counted 600 residents aged 65 and older among 6,000 people there. Complete the description.
Between the two censuses, the number of residents aged 65 and older , and their share of the neighborhood's population . At the second census, that share was .
2c. Field studies and narratives: how people feel
Qualitative data are information recorded as words, images and observations rather than counts. In urban geography they come mostly from two sources.
A field study is research done in the place itself. The researcher walks the streets, photographs buildings, sketches how land is used and talks with residents and shop owners. The dashed route on the map at the top of the page is a field study through Tract 2 of City H.
A narrative is a person's own account of events and experiences: an oral history, a letter to a local newspaper, a blog post, or testimony at a public meeting. An interview done during a field study is part of the study, and what the person says in their own words is a narrative.
These sources show individual attitudes toward urban change, which no count records. At the first stop on the City H route, a woman who has lived in Tract 2 for thirty years tells the researcher that her rent has climbed and her old neighbors are gone. At the third stop, a nurse who moved in last year says she likes walking to the new clinic. The census says only that Tract 2 grew by 1,200 people. The interviews show that the growth means loss to one resident and opportunity to another.
Quick check · Sort it
Each card is a piece of information about a neighborhood in a hypothetical city. Tap a card, then the kind of data it is.
Quantitative data
Qualitative data
2d. Using both to explain change
Each kind of data answers different questions, so geographers use both to show the causes and effects of change inside a city.
Quantitative data measure the effects: how much a neighborhood grew or shrank, which groups became a larger or smaller share, and where on a map the change happened. They can point to a cause when a change lines up with something else in the data, such as a rise in young adults in the tracts beside a new rail stop. They do not record why people moved or how they feel.
Qualitative data record attitudes and reasons in people's own words: why a family moved in, why a shop owner fears the rail stop, why a long-time resident feels pushed out. They come from a small number of people, so they cannot show how widespread a view is.
Each source has limits to keep in mind. A census is taken years apart and can miss some people. A survey asks only a sample, so its shares are estimates. A field study records one place at one time, and what a researcher already believes can shape what the notes record.
Quick check · Decide and justify
A hypothetical city plans a new rail station in one of its neighborhoods. Before it builds, the planning office wants to learn how long-time residents of that neighborhood feel about the station. Which data should the office gather?
Which reason supports your answer?
Part 3 Watch it done What the census says about Linden Park
Watch each step, then do the last one yourself.
Linden Park is a neighborhood in a hypothetical city. At Census 1 it had 5,000 residents, 1,000 of them aged 20 to 34. At Census 2, ten years later, it had 6,500 residents, 2,600 of them aged 20 to 34. Field notes from the same year describe three new apartment buildings beside a new light-rail stop. Work out what the census shows about the change in Linden Park's size and composition.
Predict first
Before the steps, what do you expect the census to show about residents aged 20 to 34?
Step 1 · Find the change in size
6,500 minus 5,000 is 1,500 more residents. Measured from the earlier count, 1,500 ÷ 5,000 × 100 = 30% growth.
Step 2 · Find the group's share at Census 1
1,000 ÷ 5,000 × 100 = 20% of residents were aged 20 to 34.
Why this step?
Why work out the group's share at each census, and not only compare its counts?
The whole neighborhood grew by 30%, so a group's count could rise just because there are more people. The share shows whether the group became a bigger part of the population, which is a change in composition.
Your step · Calculate
Finish it. Work out the share of Linden Park's residents aged 20 to 34 at Census 2, then compare it with the 20% at Census 1. By how many percentage points did that group's share change?
percentage points
Part 4 Try it Plan a study of a changing neighborhood
Ashford, a neighborhood in a hypothetical city, lost its largest employer when an old factory closed. The city's planners want to understand what has changed there and how residents feel about it.
Try it · Match
Match each source of data to the example from the Ashford study that comes from it.
Try it · Multiple choice
The census shows that Ashford's population fell by 30% between the two counts, while the share of its residents aged 65 and older rose. Which conclusion do these census numbers alone support?
Part 5 Explain it Explain a neighborhood's change from its data
Nothing you type leaves this page. Check your answer against the model and each scoring point.
Free response is 50% of the exam score. This one is shaped like Question 2, from free-response II.
Free-response practice · Question 2 style
Stimulus, a hypothetical table: census data for Riverside, a neighborhood in hypothetical City W, at two censuses taken ten years apart.
- Total residents: 9,000 at the first census; 12,000 at the second
- Residents aged 20 to 34: 1,800 at the first census; 4,800 at the second
- Households: 3,000 at the first census; 5,000 at the second
- Households that rent their home: 1,500 at the first census; 3,500 at the second
(A) Identify the kind of data the table shows.
(B) Describe the change in the size of Riverside's population shown in the table.
(C) Describe one change in the composition of Riverside's population shown in the table.
(D) Using the table, explain one likely cause of the changes in Riverside.
(E) Identify one kind of qualitative data a researcher could collect in Riverside.
(F) Explain how the qualitative data you identified in part (E) could show something about Riverside that the table cannot.
(G) Explain one limitation of the census data in the table for understanding change in Riverside.
Model answer
(A) Quantitative data, from a census.
(B) Riverside grew from 9,000 to 12,000 residents, 3,000 more people, which is about 33% growth over ten years.
(C) Residents aged 20 to 34 went from 20% of the population (1,800 of 9,000) to 40% (4,800 of 12,000), so young adults became a much larger part of the neighborhood.
(D) The number of renting households more than doubled, from 1,500 to 3,500, while the total number of households grew by 2,000. That points to new rental apartments being built. Young adults are often renters, so new apartments would draw them in, which fits the rise in residents aged 20 to 34.
(E) Interviews with residents during a field study, or narratives such as residents' letters or testimony at a city council meeting.
(F) Interviews would record how individual residents feel about the change in their own words. A long-time owner might say rising rents and new buildings have pushed out old neighbors, while a new renter might value being close to work. The table shows how many people changed, but it records no attitudes.
(G) A census is taken only every ten years, so the table cannot show when during the decade the change happened or whether it is still going on, and it records who lives in Riverside, not why they moved there.
Score your own answer. This is a self-check, not a grade. Tick each point your answer makes.
Part 6 Check yourself The data on Northgate
The case questions use the table and the field study. The others mix the ideas from the whole lesson.
Northgate is a neighborhood in hypothetical City X. The table gives counts from two censuses ten years apart, and one row from a survey of 400 households taken in each census year. A field study in the second census year recorded a closed bowling alley and two new apartment buildings, and a long-time resident told the researcher, "I hardly know anyone on my street now."
| Measure | Census 1 | Census 2 |
|---|---|---|
| Total residents (census) | 6,000 | 7,500 |
| Residents aged 65 and older (census) | 900 | 750 |
| Households that own their home (census) | 2,000 | 1,500 |
| Surveyed households that moved in within the last 5 years (survey of 400) | 15% | 40% |
Case question 1 · Multiple choice
Which statement is best supported by the census rows of the table?
Case question 2 · Calculate
Use the census rows of the table. How many more residents under 65 lived in Northgate at Census 2 than at Census 1?
Case question 3 · Multiple choice
The long-time resident's remark to the researcher is which kind of data, and what can it show?
The rest stand on their own and do not use the case.
Check yourself · Spot the error
A student uses data to describe change in a neighborhood of a hypothetical city. Which line is the first to go wrong?
Check yourself · Select all
Which two are limitations of qualitative data from field studies and narratives? Select two.
Select 2 answers, then check.
Part 7 Keep it Bring back earlier ideas
Brings back ideas from Topics 6.8 and 6.7.
From 6.8 Urban Sustainability · Calculate
A hypothetical city plans 5,000 new homes for transportation-oriented development along a new rail line. Of them, 2,400 are within 400 m of a station, 1,600 are between 400 m and 800 m from a station, and 1,000 are farther than 800 m. Taking a short walk as 800 m or less, what percent of the new homes are within a short walk of a station?
From 6.7 Infrastructure · Multiple choice
In a hypothetical city, District R sits on low ground along a river, and its storm drains are old and too small for heavy rain. District S, on higher ground, has new storm drains. Over the next twenty years, which difference between the districts is most likely?
In three lines
- Quantitative data: censuses count everyone and surveys ask a sample, and both measure changes in an urban population's size and composition.
- Qualitative data: field studies and narratives record what people see, say and feel, so they show individual attitudes toward urban change.
- Used together: numbers measure what changed and where, and words help explain why and what the change means to residents.
Exam strategy for this topic
- Section I, Multiple Choice: 60 questions in 60 minutes.
- Section II, Free Response: 3 questions in 75 minutes.
When a question gives an urban data table, describe the change with the table's own numbers, from what to what and as a share of the total, then say what the table cannot show and which other kind of data would show it.
Questions students ask
What is the difference between quantitative and qualitative data?
Quantitative data are numbers, such as census counts and survey percentages, that measure how many people live in a place and who they are. Qualitative data are words, images and observations, from field studies and narratives, that show how people experience a place and feel about changes to it.
Is a survey quantitative or qualitative?
In this topic, survey data are quantitative: a survey's answers are counted into numbers and shares, like a percentage of households that rent. If a survey asks an open question that people answer in their own words, those answers are qualitative, so look at the form the answers take.
Why not use the census for everything?
A census is taken years apart, can miss some people, and records only counts and traits. It cannot say why people moved or how they feel about a change, which is what field studies and narratives add.
Is one kind of urban data better than the other?
No. They answer different questions. Numbers measure how much a city changed and where; people's own words help explain why and show what the change means to them. Geographers use both.
Are the cities and neighborhoods in this lesson real?
No. Every city, neighborhood, tract and person here is hypothetical, and every number was chosen to show an idea clearly. Real census tables and field studies are messier.
Course alignment, for teachers
AP Human Geography topic 6.9, Unit 6: Cities and Urban Land-Use Patterns and Processes.
- Skill 3.E: Explain what maps or data imply or illustrate about geographic principles, processes, and outcomes.
This lesson maps all 2 essential knowledge statements of the topic to the part that teaches each one: 2 are checked by a scored question. The map is in the lesson file.