Unit 6 · Topic 6.4 · about 30 minutes · 7 parts · 14 scored checks, 3 of them multiple choice
AP Human Geography 6.4: The Size and Distribution of Cities
Unit 6: 12 to 17% of the multiple-choice section
What you'll be able to do
- Identify how the rank-size rule, the primate city, the gravity model and Christaller's central place theory explain the hierarchy, interdependence, relative size, spacing and interaction of cities, and use each one to read city data or a map.
Key vocabulary
| Term | What it means | The exam trap |
|---|---|---|
| Rank-size rule | A model that predicts each city's population from its rank and the size of the country's largest city. | Compare each city with the rule's prediction for its rank, not only with the city above it. |
| Primate city | A country's largest city when it is far larger than the second city, by a common test well over twice its size, and dominates the country's economic, political and cultural life. | Compare the largest city with the second city before you use the term. |
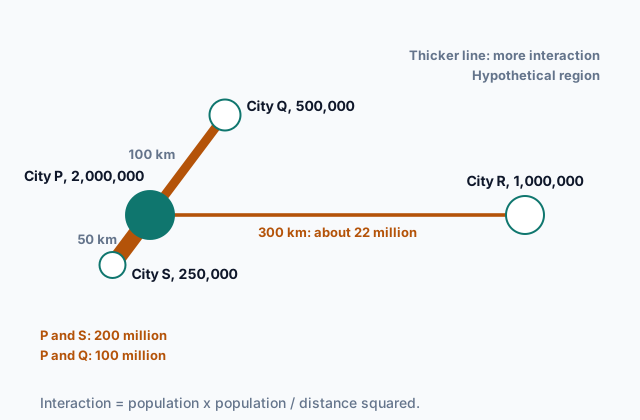
| Gravity model | A model that predicts more interaction between places with larger populations and less between places farther apart; this lesson uses population times population divided by distance squared. | Its result is an index for comparing pairs of places, so do not read it as a count of trips or people. |
| Central place theory | Walter Christaller's theory of how settlements that supply goods and services to the surrounding area are sized and spaced across a region. | It is a model built on stated assumptions, so learn the assumptions along with the pattern. |
| Threshold | The minimum number of people needed to support a good or service. | It counts people, so it never answers a question about how far. |
| Range | The maximum distance people are willing to travel to get a good or service. | It measures distance, so it never answers a question about how many customers. |
| Market area | The area around a central place whose people come to it for a good or service, also called its hinterland. | One place can have a different market area for each good it sells. |
 Tap to open the picture full size
Part 1 Think first Guess the fourth city
Commit to a guess first. Being wrong now makes the right idea stick better.
Predict first
A geography student is reading a table of the largest cities in a hypothetical country. The largest city has 6.0 million people, the second has 3.0 million, and the third has 2.0 million. If the pattern holds, about how many people live in the fourth-largest city?
In short. Four principles explain the size, spacing and interaction of cities: the rank-size rule and the primate city describe how a country's city sizes compare, the gravity model predicts how much two places interact, and Christaller's central place theory explains how towns and cities that serve a region are spaced.
- Under the rank-size rule, the city ranked n has about the largest city's population divided by n; a primate city is far larger than the second city, well over twice its size, where the rule expects about twice, and dominates its country.
- The gravity model predicts more interaction between places that are larger and closer. This lesson uses population times population, divided by distance squared, and compares pairs.
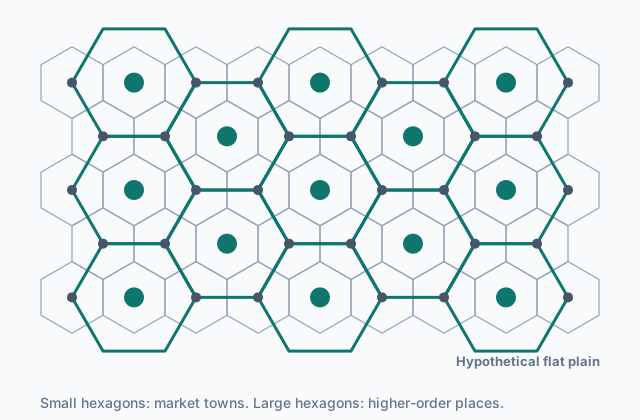
- In central place theory each place serves a hexagonal market area, and places that offer higher-order goods, with larger thresholds and longer ranges, are fewer and farther apart.
Part 2 Learn it Four principles for the size and spacing of cities
2a. The rank-size rule
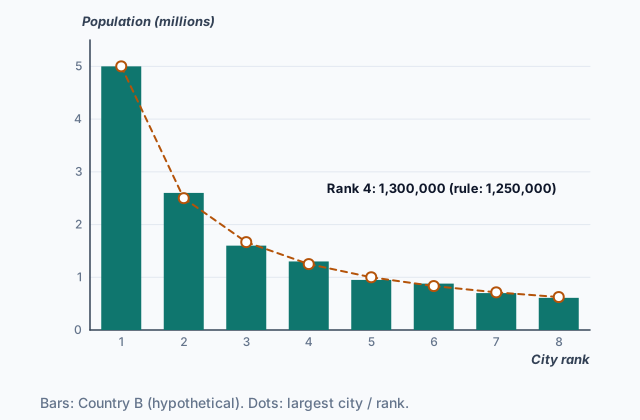
To compare the sizes of a country's cities, rank them from largest to smallest. The rank-size rule says the city ranked n has about the largest city's population divided by n. The second city has half as many people as the largest, the third a third as many, the fourth a quarter as many.
The chart shows hypothetical Country B. Its largest city has 5,000,000 people, so the rule predicts 5,000,000 divided by 4, or 1,250,000, for the fourth city. The real fourth city has 1,300,000, close to the prediction, and every other city sits close to its own prediction too.
 Tap to open the picture full size
A country that fits the rule has an urban hierarchy with many steps: a few large cities, more middle-sized ones and many small ones. No single city holds most of the people, jobs and services, so cities at every level depend on one another. The rule is about relative size: what matters is each city compared with the largest, not how many people the country has.
Quick check · Calculate
In hypothetical Country C, the largest city has 4,800,000 people. If Country C's cities follow the rank-size rule, how many people would you expect in its sixth-largest city?
2b. The primate city
Some countries break the rank-size pattern at the very top. A primate city is a country's largest city when it is far larger than the second city, by a common test well over twice its size, and it dominates the country's economy, government and culture. Under the rank-size rule the largest city is about twice the second, so a ratio near 2 fits the rule. A primate city sits well above that, and the cities below it sit well under their predictions.
Take hypothetical Country D:
| Rank | Population | Rank-size prediction |
|---|---|---|
| 1 | 8,000,000 | 8,000,000 |
| 2 | 1,400,000 | 4,000,000 |
| 3 | 1,000,000 | about 2,670,000 |
The largest city is more than five times the size of the second. It is a primate city: one city at the top that draws investment, jobs and migrants, with the rest of the country's cities depending on it.
Two warnings. Every country has a largest city, and being the largest or the capital does not make a city primate; compare it with the second city. And a country can fit neither pattern. If its two largest cities are nearly the same size, the largest is not primate, and the second is far bigger than the rank-size rule predicts.
Quick check · Sort it
Each card gives the populations of the three largest cities in a hypothetical country. Tap a card, then the pattern it shows.
Close to the rank-size rule
Has a primate city
Fits neither pattern
2c. The gravity model
The gravity model predicts how much two places interact: trade, migration, commuting, phone calls, shopping trips. As with gravity in physics, the pull grows with size and falls with distance. This lesson uses this form throughout:
interaction = (population of place 1 × population of place 2) ÷ (distance between them)²
Distance can be measured in kilometers, travel time or cost. The result is an index, not a count of trips, so use it to compare pairs: which pair interacts more, and by how many times.
Squaring the distance makes distance count heavily. Take a city of 1,000,000 people and a city of 400,000 people 100 km apart: 1,000,000 × 400,000 ÷ 100² = 40,000,000. Put them 200 km apart and the index falls to 10,000,000. Doubling the distance cuts the predicted interaction to a quarter, not a half.
The picture at the top of the page shows the model at work. City S is the smallest city on the map, but it is the closest to City P, so it is predicted to interact with P the most. Large places close together are tied by heavy flows of people, goods and information, which is why a town near a big city is drawn into that city's orbit.
Quick check · Rank it
Using the gravity model, with population times population divided by distance squared, rank these four pairs of hypothetical cities by predicted interaction. Work out an index for each pair before you rank.
Most interaction first
Give each one a place, 1 for first. Give two the same place if they are equal.
Your ranking: none yet
2d. Central place theory
Walter Christaller's central place theory explains how settlements that serve the people around them are spaced across a region. A central place provides goods and services to its market area, the surrounding area whose people come to it.
The threshold of a good or service is the minimum number of people needed to support it: a corner grocery needs only the people of a small town, while a heart surgery center needs the people of a whole region. The range is the maximum distance people will travel for it: a short drive for milk, much farther for surgery. Goods with a low threshold and a short range are low-order; those with a high threshold and a long range are high-order.
Places form a hierarchy. Many small market towns, close together, sell low-order goods. Fewer, larger places, farther apart, also sell high-order goods, to big market areas. The levels are interdependent: towns rely on the larger place for high-order goods, and its services rely on the towns' people to reach their thresholds.
Christaller assumed a flat plain with no barriers, people spread evenly, and travel equally easy in every direction. Under those assumptions he drew market areas as hexagons. Circles around evenly spaced places would overlap or leave gaps. Of the regular shapes that fit together with no gaps (triangles, squares and hexagons), the hexagon is the closest to a circle.
 Tap to open the picture full size
Quick check · Fill the statement
Complete the description of Christaller's model.
Christaller drew each market area as a . A place selling higher-order goods needs a market area to reach its threshold, so a region holds such places than places selling only lower-order goods.
Part 3 Watch it done Which city does the town lean toward?
Watch each step, then do the last one yourself.
In a hypothetical region, Town T has 40,000 people. City M, with 900,000 people, is 150 km from Town T. City N, with 450,000 people, is 50 km from Town T. Using the gravity model, with the distance squared, predict which city Town T will interact with more, and how many times as much.
Predict first
Before the steps, which city do you expect Town T to interact with more?
Step 1 · Write the model for each pair
Interaction = (population × population) ÷ distance². Town T is in both pairs, so its 40,000 people appear in both.
Step 2 · Work out Town T and City M
40,000 × 900,000 ÷ 150² = 36,000,000,000 ÷ 22,500 = 1,600,000.
Why this step?
Why work out an index for each pair and compare them, instead of reading 1,600,000 as a number of trips?
The gravity model gives a relative measure. Its number means nothing on its own; what it predicts is which pair interacts more, and by how many times.
Your step · Calculate
Finish it. Work out the index for Town T and City N, then divide it by the index for Town T and City M, 1,600,000. How many times as much interaction does the gravity model predict between Town T and City N as between Town T and City M?
times
Part 4 Try it Plan services for a region
Try it · Match
A hypothetical farming region has many small market towns and one regional city. Match each idea from central place theory to the observation that shows it.
Try it · Decide and justify
In the same region, the market towns are spread evenly about 10 km apart, and the regional city is the largest place. A health company will open one children's hospital for the whole region. Where should it go?
Which reason supports your answer?
Part 5 Explain it Explain a region's towns and cities
Nothing you type leaves this page. Check your answer against the model and each scoring point.
Free response is 50% of the exam score. This one is shaped like Question 1, from free-response II.
Free-response practice · Question 1 style
A hypothetical farming region sits on a wide, flat plain. Market towns about 10 km apart each have a grocery store and a gas station. One regional city, about 40 km from most of the towns, has the region's only hospital, department store and university.
(A) Identify the place in the region with the largest market area.
(B) Using the hospital, describe the difference between threshold and range.
(C) Explain why the market towns are closer together than places like the regional city.
(D) A new highway cuts the travel time from the region to the country's largest city, which is far away. Using the gravity model, explain one likely effect on the regional city's department store.
(E) Describe how distance decay shows up in where each market town's grocery shoppers come from.
(F) Many young adults move from the market towns to the regional city. Explain one pull factor behind this migration.
(G) Explain one limitation of central place theory for explaining where real towns and cities are.
Model answer
(A) The regional city, which serves the whole region for its hospital, department store and university.
(B) The hospital's threshold is the minimum number of people needed to keep it open, which is large, so only a place that serves the whole region can support it. Its range is the maximum distance people will travel to it, which is long: families drive 40 km or more for hospital care.
(C) Groceries and gasoline are low-order goods. Their threshold is low, so the people around one small town can support a store, and their range is short, so people will not drive far for them. Each market area is small, and the towns that serve them can be close together. Higher-order services need much larger market areas, so the places that offer them are fewer and farther apart.
(D) The gravity model predicts more interaction between places that are larger and closer. The highway cuts the travel-time distance to a much larger city, so predicted interaction with it rises. Some shoppers will skip the regional department store for the larger city's stores, and the store may lose enough customers to fall below its threshold.
(E) Distance decay means interaction falls as distance grows. Most of a town's grocery shoppers live in or close to that town, and fewer and fewer come from farther away, until shoppers at the edge of its market area are closer to the next town's store and go there instead.
(F) One pull factor is jobs: the regional city's hospital, university and stores offer work and training that the small towns cannot.
(G) The theory assumes a flat plain, people spread evenly and equal travel in every direction. Real rivers, mountains, coasts and highways bend travel, and people do not always shop at the nearest place, so real towns rarely sit in neat hexagons.
Score your own answer. This is a self-check, not a grade. Tick each point your answer makes.
Part 6 Check yourself The cities of Country Q
The case questions use the table. The others mix the ideas from the whole lesson.
Hypothetical Country Q's government publishes the populations of its five largest cities. The largest city is also the capital, the main port and the home of most national companies.
| City rank | Population |
|---|---|
| 1 | 7,200,000 |
| 2 | 1,600,000 |
| 3 | 1,200,000 |
| 4 | 900,000 |
| 5 | 720,000 |
Case question 1 · Multiple choice
Which statement best describes the pattern of city sizes in Country Q?
Case question 2 · Calculate
By how many people does Country Q's second-largest city fall short of what the rank-size rule predicts for it?
Case question 3 · Multiple choice
Country Q's government moves several national ministries to its second-largest city and builds a new port there. If these policies work as planned over several decades, which change is most likely?
The rest stand on their own and do not use the case.
Check yourself · Spot the error
A student uses central place theory to say where services will locate in a region. Which line is the first to go wrong?
Check yourself · Select all
Which two are assumptions Christaller built central place theory on? Select two.
Select 2 answers, then check.
Part 7 Keep it Bring back earlier ideas
This lesson stands on world cities from Topic 6.3 and site and situation from Topic 6.1.
Bring it back · Multiple choice
Where do world cities sit in the urban hierarchy, and what role do they play?
Bring it back · Fill the statement
Two cities in a hypothetical country grew for different reasons.
City F was founded on a hill above a river bend, easy to defend and safe from floods, so its explains its origin. City G grew into a trading center because it sits where two railroads cross, so its explains its growth.
In three lines
- Rank-size rule: the city ranked n has about the largest city's population divided by n; a primate city is far larger than the second and dominates its country.
- Gravity model: interaction grows with the two populations and falls with the distance squared, so compare pairs.
- Central place theory: threshold and range set each good's market area, and higher-order places are fewer and farther apart, with hexagonal market areas.
Exam strategy for this topic
- Section I, Multiple Choice: 60 questions in 60 minutes.
- Section II, Free Response: 3 questions in 75 minutes.
When a question gives a table of city sizes, divide the largest city by each rank before you name a pattern. When it asks about interaction, say which way size pushes it and which way distance pushes it.
Questions students ask
Is the gravity model divided by distance or by distance squared?
Both forms appear in human geography textbooks. This lesson uses distance squared throughout. Either way, larger places and closer places interact more, and you should say which form you are using.
Does every country follow the rank-size rule or have a primate city?
No. Some come close to the rank-size rule, some have a primate city, and some fit neither, such as a country whose two largest cities are nearly the same size.
Why did Christaller use hexagons instead of circles?
Circles drawn around evenly spaced places either overlap, so some people sit in two market areas, or leave gaps that no place serves. Of the regular shapes that fit together with no gaps (triangles, squares and hexagons), the hexagon is the closest to a circle.
What is the difference between threshold and range?
Threshold is the minimum number of people a good or service needs to survive. Range is the maximum distance people will travel to get it. A high-order service has a high threshold and a long range.
Are the countries and cities in this lesson real?
No. Every country, region and city here is hypothetical, with numbers chosen to show each principle clearly. Real countries fit these principles more loosely.
Course alignment, for teachers
AP Human Geography topic 6.4, Unit 6: Cities and Urban Land-Use Patterns and Processes.
- Skill 2.C: Explain a likely outcome in a geographic scenario using geographic concepts, processes, models, or theories.
This lesson maps the one essential knowledge statement of the topic to the part that teaches each one: 1 is checked by a scored question. The map is in the lesson file.