Unit 6 · Topic 6.5 · about 30 minutes · 7 parts · 12 scored checks, 3 of them multiple choice, plus 2 from earlier lessons
AP Human Geography 6.5: The Internal Structure of Cities
Unit 6: 12 to 17% of the multiple-choice section
What you'll be able to do
- Explain how land uses and people are arranged inside cities, using bid-rent theory, the Burgess concentric-zone, Hoyt sector, Harris and Ullman multiple-nuclei and galactic city models, and the urban models drawn from Latin America, Southeast Asia and Africa.
Key vocabulary
| Term | What it means | The exam trap |
|---|---|---|
| Bid-rent theory | The theory that what each land user will pay for land changes with distance from the central business district, and that each site goes to the user that bids the most for it. | Compare every user's bid at the same distance; the user that bids most at the center does not win everywhere. |
| Burgess concentric-zone model | A model that draws a city as rings around its central business district, each ring with its own land use and type of housing. | Learn the rings in order and which way income changes across them before you compare it with other models. |
| Hoyt sector model | A model that draws a city as wedges of land use running out from the central business district along transportation routes. | Look at which side of downtown a land use is on, not only how far from downtown it is. |
| Harris and Ullman multiple-nuclei model | A model of a city that grows around several separate centers of activity rather than around one central business district alone. | Do not mix it up with the galactic city model; check the scale of the area each one describes. |
| Galactic city model | A model of a metropolitan area spread out into many centers, such as suburban business districts and edge cities, linked by highways. | It describes a whole metropolitan area, not the neighborhoods of one city. |
| Latin American city model | A model of the internal structure of large cities in Latin America that combines rings with a sector. | Learn the names of its zones and what each one holds. |
| Southeast Asian city model | A model of the internal structure of large cities in Southeast Asia, many of them shaped by colonial trade. | Learn what it is organized around, because it is not the same as in the North American models. |
| African city model | A model of the internal structure of large cities in sub-Saharan Africa, shaped by colonial rule and fast growth. | Learn each of its business districts by what it was built for, because they are not all of one kind. |
 Tap to open the picture full size
Part 1 Think first Who gets the downtown lot?
Commit to a guess first. Being wrong now makes the right idea stick better.
Predict first
In hypothetical City T, a lot downtown costs about twenty times as much per square meter as a lot of the same size at the city's edge. Three buyers want the same downtown lot. Which one is most likely to outbid the other two?
In short. Urban models explain how land uses and people are arranged inside a city: bid-rent theory explains why land value falls away from the central business district, four models describe North American cities, and three more describe cities in Latin America, Southeast Asia and Africa.
- Under bid-rent theory, the land user that gains most from access outbids the others at each distance, so stores and offices take the CBD, and land value and building height fall outward.
- The Burgess model draws rings with income rising outward, the Hoyt model wedges along transportation routes, the Harris and Ullman model several separate centers, and the galactic city model a metro area spread into many highway-linked centers.
- The Latin American model has an elite spine with wealth falling outward, the Southeast Asian model centers on the old colonial port zone, and the African model has three CBDs side by side.
Part 2 Learn it Models of a city's internal structure
2a. Bid-rent theory and the Burgess concentric-zone model
Inside a city, each piece of land goes to whoever will pay the most for it. Bid-rent theory explains the pattern that results. Most roads and transit lines meet at the central business district (CBD), so it is the place the most workers and customers can reach. What a land user will pay, its bid rent, falls with distance from the CBD. Stores and offices gain the most from that access, so their bids are highest at the center and fall the fastest. They take the CBD and build tall to get the most from costly land. Factories and warehouses come next, then housing, and at the edge farming, which needs a lot of land and little access. So land values and building heights fall from the center outward.
Ernest Burgess's concentric-zone model, from the 1920s, draws the city as five rings around the CBD:
- the CBD, with offices, department stores and the tallest buildings;
- the zone of transition, with factories, warehouses and crowded, worn housing where the newest and poorest arrivals settle;
- the zone of working-class homes;
- the zone of better residences, for middle-class families;
- the commuter zone, whose residents travel in to work.
As families earn more, they move out a ring, and newer arrivals take their place. The city grows outward ring by ring, so in this model household income rises with distance from the CBD.
Quick check · Fill the statement
Complete the description of how land is used inside a city.
Under bid-rent theory, the land users that gain the most from being easy to reach, such as , outbid all others for land in the . In the Burgess concentric-zone model, household income with distance from that center.
2b. The Hoyt sector model and the Harris and Ullman multiple-nuclei model
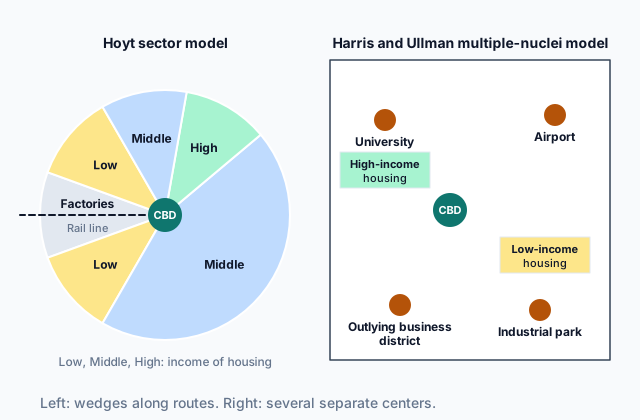
Homer Hoyt's sector model, from the late 1930s, keeps the CBD at the center but swaps rings for wedges, or sectors, that run out from it along transportation routes. A land use that starts on one side of downtown keeps growing outward on that side. Factories stretch out along a rail line or a river, and low-income housing grows beside them. High-income housing follows the most attractive corridor, such as a boulevard or high ground, out to the edge, and middle-income housing fills the wedges between. So the rich and the poor can live at the same distance from downtown, on different sides of it, which rings cannot show.
 Tap to open the picture full size
Chauncy Harris and Edward Ullman's multiple-nuclei model, from 1945, drops the single center. As cars spread, a city grows around several nodes: the CBD, but also an outlying business district, a university, an airport, a port or an industrial park. Four forces sort land uses among them. Some activities need a special site, as a port needs deep water. Similar activities cluster to help each other, as law offices gather near a courthouse. Some activities repel each other, so expensive housing stays away from heavy industry. And some cannot pay the rent at the best nodes, so they take cheaper land between them.
Quick check · Sort it
Each card describes part of a hypothetical city. Tap a card, then the model it shows best.
Burgess concentric-zone model
Hoyt sector model
Harris and Ullman multiple-nuclei model
2c. The galactic city model
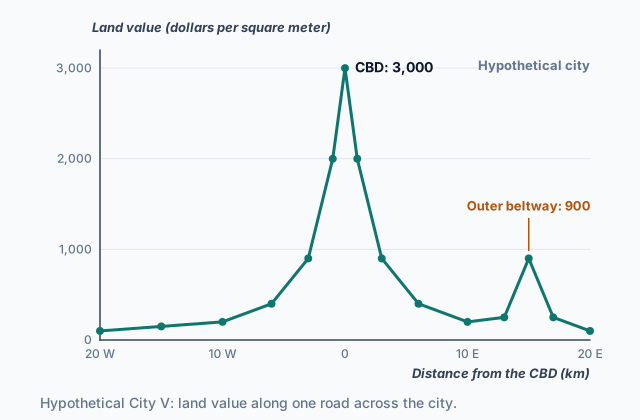
After the mid-1900s, highways and cars let North American metro areas spread far past the old city, and phone and, later, internet links meant many offices no longer needed a downtown address. The galactic city model describes the metro area this produced. The old CBD is one center among many, and often not the largest. Scattered across the metro area are suburbs, office parks, shopping malls, airports and edge cities: large clusters of offices, stores and hotels that grow at highway interchanges, often along an outer beltway, with no old downtown of their own. Land value rises again at these interchanges, because they are easy to reach too, so a land-value graph across such a metro area shows smaller peaks away from the CBD. Highways tie these centers to one another, so many people live, work and shop in the suburbs and rarely go downtown. Like stars in a galaxy, the centers are spread across the whole metro area.
The galactic city model differs from the multiple-nuclei model in scale and in the role of downtown. Harris and Ullman's nuclei sit inside one city, with the CBD still among the most important of them. The galactic city spreads a whole metro area into many centers, and the CBD no longer anchors it.
Quick check · Multiple choice
Hypothetical Metro Area G grew mostly after its highways were built. Its old CBD holds a small share of its jobs, and offices, malls and housing tracts are spread across the region at highway interchanges. Which statement best explains why the Burgess concentric-zone model describes G poorly?
2d. Urban models from Latin America, Southeast Asia and Africa
Models drawn from North American cities do not fit everywhere. Three more come from cities shaped by colonial rule and fast growth.
The Latin American city model mixes rings and a sector. A CBD grows around the old central plaza, and a spine of offices, shops and elite homes runs out from it along a wide boulevard. Outside the spine, rings get poorer outward: the zone of maturity, with established homes and full services; the zone of in situ accretion, where families are still enlarging their homes and services are still arriving; and at the edge, peripheral squatter settlements of self-built homes. Disamenity sectors, along ravines, dumps or rail lines, hold the poorest of all. Wealth falls with distance from the center, the reverse of the Burgess model.
The Southeast Asian city model is organized around the old colonial port zone, not a single CBD. Around the port sit a government zone, a Western commercial zone and commercial zones for foreign merchants, then mixed land uses and housing, and at the edge new suburbs, squatter areas, market gardens and an industrial estate.
The African city model has three CBDs side by side: a colonial CBD of offices and banks, a traditional CBD of small, older businesses, and an open-air market zone. Around them lie ethnic and mixed neighborhoods and a mining and manufacturing zone, and informal satellite townships of self-built homes ring the outskirts.
Quick check · Match
Match each model of a city's internal structure to the feature it is known for.
Part 3 Watch it done Where does each land use end?
Watch each step, then do the last one yourself.
Along one road out of hypothetical City B, three land users bid for land. The bids are invented for this lesson, in dollars per square meter per year. Offices bid 2,400 at the CBD, and 300 less for each kilometer out. Housing bids 900 at the CBD, and 50 less for each kilometer out. Farms bid 150 at any distance. Using bid-rent theory, find where offices give way to housing and where housing gives way to farms.
Predict first
Before the steps, where do you expect offices to give way to housing?
Step 1 · State the rule
At each distance the land goes to the highest bidder. One land use gives way to the next where their two bids are equal.
Step 2 · Offices and housing
Offices start 2,400 minus 900, or 1,500, higher than housing, and lose 300 minus 50, or 250, more for each kilometer. So the gap closes at 1,500 divided by 250, which is 6 km. There each bids 600: 2,400 minus 6 times 300, and 900 minus 6 times 50. Inside 6 km offices win; past it, housing does.
Why this step?
Why does housing win past 6 km, when offices bid far more at the CBD?
Offices' bids fall faster. They gain the most from being easy to reach, so each kilometer away costs them more than it costs housing, and past the point where the bids meet, housing outbids them.
Your step · Calculate
Finish it. In hypothetical City B, housing bids 900 dollars per square meter per year at the CBD and 50 less for each kilometer out, and farms bid 150 at any distance. How many kilometers from the CBD does housing give way to farms?
km
Part 4 Try it Read a city's land market
Try it · Rank it
In hypothetical City W, four land users bid for land, in dollars per square meter per year, invented for this lesson. Using bid-rent theory, rank what each would bid for a site 4 km from the CBD. Work out each bid at 4 km before you rank.
Highest bid first
Give each one a place, 1 for first. Give two the same place if they are equal.
Your ranking: none yet
Try it · Decide and justify
Hypothetical City K grew around one CBD. Its wealthiest neighborhood starts near the CBD and runs east along a riverside boulevard. A rail line lined with factories runs west. A developer will build expensive homes on new land at the city's edge. Using the Hoyt sector model, where should the homes go?
Which reason supports your answer?
Part 5 Explain it Explain the shape of a metro area
Nothing you type leaves this page. Check your answer against the model and each scoring point.
Free response is 50% of the exam score. This one is shaped like Question 2, from free-response II.
Free-response practice · Question 2 style
Stimulus, a hypothetical land-use map of Metro Area H in North America, described in words:
- An old central business district (CBD), with the metro area's tallest buildings, sits at a river port in the center.
- A rail line runs west from the CBD along the river. Factories, with low-income housing beside them, line it in a wedge from the edge of the CBD out to the edge of the city.
- A wedge of expensive homes runs north from the CBD along a ridge with views of the river.
- About 25 km out, an outer beltway circles the metro area. At three of its interchanges stand large clusters of offices, stores and hotels, each with more office space than the old CBD.
- Housing tracts fill the land between the interchanges.
(A) Identify the model of urban structure that the wedges west and north of the CBD best show.
(B) Describe how the expensive homes north of the CBD fit the model you identified in part (A).
(C) Using bid-rent theory, explain why the tallest buildings in the old city are in the CBD.
(D) Explain how the clusters at the beltway interchanges show the galactic city model.
(E) Explain one way the map does not fit the Burgess concentric-zone model.
(F) Compare where the poorest households live in Metro Area H with where the Latin American city model places them.
(G) Explain one reason a single model cannot describe all of Metro Area H.
Model answer
(A) The Hoyt sector model.
(B) The expensive homes form a wedge that starts near the CBD and runs outward along the ridge, an attractive corridor, to the edge of the city. In the sector model, high-income housing follows such a corridor and keeps growing outward on the same side of the city, away from the factory wedge in the west.
(C) Bid-rent theory says each land user's bid for land falls with distance from the CBD, and the users who gain most from access bid most at the center. The CBD is where the port, the rail line and the main roads meet, so offices and stores outbid everyone there. Land that costly is used intensively, so they build upward to fit more floor space on each lot.
(D) The galactic city model describes a metro area spread into many centers linked by highways, with the old CBD as one center among many. The beltway clusters are such centers, edge cities with more office space than the old CBD, tied together by the beltway rather than by roads into downtown.
(E) The Burgess model draws land uses as rings around one CBD. In Metro Area H, factories and expensive homes each run as wedges from the center to the edge, so they cross what would be several rings, and the largest office centers sit 25 km out instead of in the middle.
(F) In Metro Area H the poorest households live in a wedge beside the factories along the rail line, which starts at the edge of the CBD and runs out to the edge of the city. The Latin American city model places the poorest at the edge, in peripheral squatter settlements, and in disamenity sectors, while the wealthy live near the center along the spine.
(G) Each model shows the city at one stage. The sectors show the older city that grew along the river and rail line, and the beltway clusters show growth in the highway era, so describing all of H needs both the sector model and the galactic city model.
Score your own answer. This is a self-check, not a grade. Tick each point your answer makes.
Part 6 Check yourself The zones of City D
The case questions use the table. The others mix ideas from the whole lesson.
A survey team mapped hypothetical City D, a large city, zone by zone. It recorded each zone's main land use and its median household income. Every number is invented for this lesson.
| Zone | Where it is | Main land use | Median household income (dollars per month) |
|---|---|---|---|
| Boulevard corridor | From the CBD along one wide boulevard to a mall 12 km out | Offices, shops and luxury apartments | 3,000 |
| Inner ring | 1 to 4 km from the CBD | Older homes with full water, power and paved streets | 1,500 |
| Middle ring | 4 to 8 km from the CBD | Homes that owners are still enlarging; some streets unpaved | 800 |
| Outer ring | 8 to 14 km from the CBD | Self-built homes on hillsides, with few services | 400 |
| Ravine strip | Along a river ravine from the CBD to the edge | Shacks on steep banks that flood | 250 |
Case question 1 · Multiple choice
Which model best fits the pattern in City D?
Case question 2 · Calculate
In City D, the median household income in the boulevard corridor is how many times the median household income in the outer ring?
Case question 3 · Multiple choice
Over the next 30 years, City D keeps drawing migrants from the countryside. Its government brings water, power and paved roads to the outer ring, and families there keep adding rooms and second stories to their homes. Using the city model that best fits City D, which change is expected?
The rest stand on their own and do not use the case.
Check yourself · Spot the error
A student uses the galactic city model to describe hypothetical Metro Area F. Which line is the first to go wrong?
Check yourself · Put it in order
In the Burgess concentric-zone model, put these land uses in order from the center of the city outward.
Part 7 Keep it Bring back earlier ideas
This lesson builds on Topics 6.3 and 6.2.
From 6.3 Cities and Globalization · Fill the statement
Complete the description of a hypothetical city.
Hypothetical City U holds the headquarters of 70 corporations and a stock exchange where investors from 40 countries trade. Decisions made there send money and jobs to other continents, so City U globalization and sits at the of the world's urban hierarchy.
From 6.2 Cities Across the World · Match
Match each place in a hypothetical metro area to the land-use term that fits it.
In three lines
- Bid-rent theory: the user that gains most from access outbids the others at each distance, so land value and building height fall away from the CBD.
- North American models: Burgess rings with income rising outward, Hoyt wedges along routes, Harris and Ullman's several nuclei, and the galactic city's highway-linked centers.
- Other models: the Latin American spine with wealth falling outward, the Southeast Asian port zone, and the African city's three CBDs.
Exam strategy for this topic
- Section I, Multiple Choice: 60 questions in 60 minutes.
- Section II, Free Response: 3 questions in 75 minutes.
When a question gives a map or description of a city, find the CBD first, then check where the wealthy and the poor live and whether land uses form rings, wedges or separate centers, before you name a model. Name the model and point to the feature that fits it.
Questions students ask
Which model of a city's internal structure is correct?
None is correct everywhere. Each describes cities shaped by certain forces at a certain time: the Burgess rings an early industrial city, the Hoyt sectors growth along rail lines and boulevards, the multiple-nuclei and galactic city models the age of cars and highways, and the Latin American, Southeast Asian and African models cities shaped by colonial rule and fast growth. A real city often shows parts of several.
How is the galactic city model different from the multiple-nuclei model?
The multiple-nuclei model describes one city growing around several nodes, with the CBD still a major one. The galactic city model describes a whole metropolitan area spread into many centers linked by highways, where the old CBD is one center among many.
Why do the wealthy live near the center in the Latin American city model?
In the model, the CBD and the spine hold the city's best jobs, services and amenities, so the wealthy live there. The newest arrivals, usually the poorest, find land only at the edge, where they build their own homes, and services reach those areas last.
What is a bid rent?
It is what a land user is willing to pay for land at a given distance from the CBD. Each user's bid falls with distance, at its own rate, and the land at each distance goes to whoever bids the most there.
Are the cities in this lesson real?
No. Every city, metro area, survey and number here is hypothetical, invented to show each model clearly. The models and the geographers who drew them are real; real cities fit the models more loosely.
Course alignment, for teachers
AP Human Geography topic 6.5, Unit 6: Cities and Urban Land-Use Patterns and Processes.
- Skill 1.E: Explain the strengths, weaknesses, and limitations of different geographic models and theories in a specified context.
This lesson maps the one essential knowledge statement of the topic to the part that teaches each one: 1 is checked by a scored question. The map is in the lesson file.