Unit 6 · Topic 6.6 · about 30 minutes · 7 parts · 12 scored checks, 3 of them multiple choice, plus 2 from earlier lessons
AP Human Geography 6.6: Density and Land Use
Unit 6: 12 to 17% of the multiple-choice section
What you'll be able to do
- Explain how the characteristics of low-, medium- and high-density housing make different patterns of residential land use, and how those buildings and patterns reflect and shape a city's culture, technology, cycles of development and infilling.
Key vocabulary
| Term | What it means | The exam trap |
|---|---|---|
| Residential land use | Land in a city given to housing, and the pattern that housing makes across the city. | A pattern is read across many blocks, so do not judge a whole neighborhood from one building. |
| Housing density | The number of housing units on a unit of land; this lesson counts housing units per acre. | Say which unit of land you used, since a count per acre and a count per square mile are very different numbers. |
| Low-density housing | Housing with few homes per acre, mainly detached single-family houses, each on its own lot. | Density is about land per home, not the size or price of the homes. |
| Medium-density housing | Housing that fits several homes on the land one house would use, such as townhouses, row houses, duplexes and low-rise apartment buildings. | Describe it by its buildings and homes per acre; a neighborhood's level does not change because of one building. |
| High-density housing | Housing with many homes per acre, in apartment or condominium buildings many floors tall. | Count homes per acre of land, so a tower set in a large park can still be high density. |
| Cycles of development | The waves of building, slowdown and rebuilding that a city, or one of its neighborhoods, goes through over time. | A neighborhood's age is evidence, not proof: a later wave can rebuild any area. |
| Infilling | Building new homes or other uses on vacant or underused land inside an area that is already built up. | Infill is not only housing: shops and offices built on unused land inside the city count too. |
 Tap to open the picture full size
Part 1 Think first Old center, new edge
Commit to a guess first. Being wrong now makes the right idea stick better.
Predict first
In hypothetical City V, the oldest neighborhood, next to downtown and built in the 1890s, is packed with row houses and three-story apartment buildings. The newest neighborhood, at the city's edge and built in the 2000s, has detached houses on half-acre lots. What explains most of the difference?
In short. Density and land use is about how many homes a city puts on its land: low-density detached houses, medium-density attached and low-rise homes, and high-density apartment buildings each make a different pattern of residential land use, and those patterns both reflect and shape a city's culture, technology, cycles of development and infilling.
- Housing density is housing units per acre of land. Low-density housing is detached houses on their own lots; medium-density is townhouses, duplexes and low-rise apartments; high-density is apartment buildings many floors tall.
- Housing reflects the culture and technology of the era that built it, from walking and streetcars to cars and elevators, and then shapes how residents live and travel for decades.
- Cities grow in cycles of development that layer housing by age, and infilling adds homes on vacant or underused land inside the built-up area, raising density without adding land.
Part 2 Learn it How density makes a pattern of land use
2a. Low, medium and high density
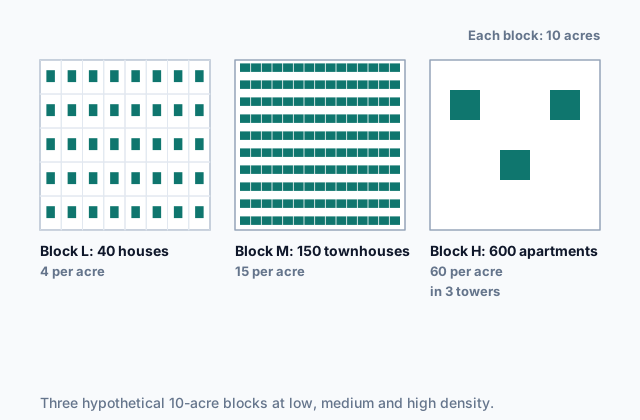
A city's residential land use is the land it gives to housing and the pattern that housing makes. One way to describe the pattern is housing density: how many housing units, the homes one household can live in, stand on each acre of land. Housing falls into three levels.
Low-density housing is detached single-family houses, each on its own lot with a yard and usually a driveway. Few homes fit on an acre, so homes spread over a lot of land, stores and jobs sit far away, and most trips are made by car.
Medium-density housing fits several homes on the land one house would use: townhouses and row houses that share side walls, duplexes, and apartment buildings of two to four floors. Yards are small or shared, and enough people live within a walk to support a corner store or a bus line.
High-density housing is apartment and condominium buildings many floors tall, reached by elevators. Hundreds of homes can stand on a few acres, with shared parks instead of private yards, and enough people within a short walk to support rail transit and street-level shops.
 Tap to open the picture full size
The blocks are hypothetical, like every place and number in this lesson. Real cities draw the lines between the levels in different places, so describe a neighborhood by its buildings and its homes per acre rather than by one cutoff.
Quick check · Sort it
Each card describes the housing on one block of a hypothetical city. Tap a card, then the level of housing density it shows.
Low-density housing
Medium-density housing
High-density housing
2b. Culture and technology
Residential buildings and land use reflect a city's culture and technology: they show what people valued, what they could build and how they could travel when the homes went up. They also shape the city: once built, they steer how people live for decades.
Technological capabilities. Before mechanized transportation most people walked to work, so homes were packed close to workplaces, and without elevators buildings stopped at a few floors. Streetcar and commuter rail lines let homes spread outward along their routes. Cars and highways let homes spread across large lots far from any job, the low-density pattern often called sprawl. Steel frames and electric elevators made high-density towers possible.
Culture. What households value and expect shows in housing too. Where owning a detached house with a private yard is a common goal, cities build wide areas of low-density housing, and zoning laws that allow only detached houses on most blocks write that value into the land. Where apartment living is ordinary, or several generations of a family live together, cities build other forms: more apartments, or larger homes around shared courtyards.
Shaping. A low-density suburb, once built, makes a car close to necessary and is hard to serve with buses or trains. A dense neighborhood makes walking, transit and corner shops workable.
Quick check · Match
In a hypothetical city, each change in transportation or building technology made a new pattern of housing possible. Match each change to the pattern it made possible.
2c. Cycles of development
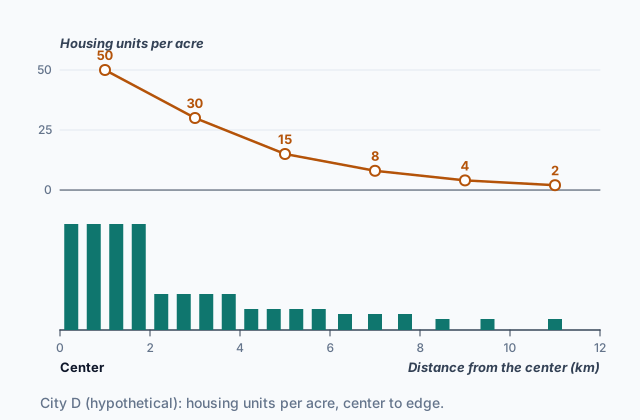
Cities do not grow at a steady pace. They grow in cycles of development: a wave of building when the economy booms or new transportation opens land, then a slowdown, then a later wave. Each wave builds in the way its own era's technology and culture allowed, and the buildings outlast the era. So a city's housing is layered by age, a little like the rings of a tree trunk. Where a city grew outward ring by ring, the oldest, densest housing sits near the center, and later rings are often built at lower density than earlier ones.
Neighborhoods have cycles of their own. A new neighborhood is built, fills and ages. As buildings wear out and households with more money move to newer areas, old homes may be divided into smaller units, left empty or torn down. Later, when land near the center is in demand again, the neighborhood may be rebuilt, often at a higher density than before.
That makes the age of housing a piece of evidence. When you compare neighborhoods, ask when each one's housing was built and what builders and residents could do then, and look for places a later wave rebuilt.
Quick check · Multiple choice
Two neighborhoods in a hypothetical city sit the same distance from downtown, on opposite sides of the city. One was built in the 1920s along a streetcar line; the other was built in the 1960s, just after a new highway opened. Which pattern of housing density is most likely?
2d. Infilling
Infilling is building new homes or other uses on vacant or underused land inside an area that is already built up: an empty lot, a surface parking lot, an old rail yard or factory site, or the back of a large house lot. It is the opposite of building on open land at the city's edge. What makes a project infill is where it is built, not its size: one small house on an empty lot and a tall tower on a parking lot both count.
Infilling raises density without adding land. A parking lot near downtown becomes a six-story apartment building; a large lot gets a second, smaller house behind the first. The new homes use roads, water pipes, sewers and transit lines that are already there, and they put more people within walking distance of shops and jobs.
Infilling reflects and shapes the city like any other building. It comes in a later cycle of development, when land in the built-up area is in demand, when building technology makes tall buildings on small sites affordable, or when more residents want to live close in. Once built, it changes daily life on the block: more neighbors, more customers for local shops, more traffic, and sometimes higher rents.
Quick check · Fill the statement
Complete the description of a project in a hypothetical city.
A builder turns a surface parking lot near downtown into a ten-story apartment building. This project is an example of . The neighborhood's housing density , and the new homes use roads, pipes and transit lines that .
Part 3 Watch it done How much does infill raise density?
Watch each step, then do the last one yourself.
Hypothetical Millbrook is an 80-acre neighborhood with 320 detached houses. Inside those 80 acres are 6 acres of old parking lots. The city lets a builder put three apartment buildings, each with 120 apartments, on the parking lots. Find Millbrook's housing density, in housing units per acre, before and after.
Predict first
Before the steps, how much do you expect Millbrook's density to change?
Step 1 · Choose the measure
Housing density = housing units ÷ acres of land. Use the whole neighborhood's 80 acres, since the question is about Millbrook, not one building.
Step 2 · Work out the density before
320 houses ÷ 80 acres = 4 housing units per acre, a low-density neighborhood.
Step 3 · Count the new homes
3 buildings × 120 apartments = 360 new housing units.
Why this step?
Why does the land stay at 80 acres after the apartments go up?
The parking lots were already inside Millbrook's 80 acres. Infilling builds on land the neighborhood already had, so the number of homes rises and the land does not.
Your step · Calculate
Finish it. Hypothetical Millbrook covers 80 acres and had 320 houses. Infilling added 360 apartments on parking lots inside those 80 acres. What is Millbrook's housing density after the infill?
housing units per acre
Part 4 Try it Compare four neighborhoods
Hypothetical City R's planning office describes four of its neighborhoods, all hypothetical: how much land each covers, how many homes it has, and when most of its housing was built.
| Neighborhood | Acres of land | Housing units | Most housing built |
|---|---|---|---|
| Canal Ward | 50 | 1,250 | 1900s |
| Eastgate | 120 | 480 | 1970s |
| Elm Park | 30 | 360 | 1920s |
| Station Square | 15 | 900 | 2010s |
Try it · Rank it
Rank City R's four neighborhoods by housing density. Work out housing units per acre for each one before you rank.
Densest first
Give each one a place, 1 for first. Give two the same place if they are equal.
Your ranking: none yet
Try it · Decide and justify
City R's planners approve a new hypothetical neighborhood, Tolvany Fields: 600 detached houses on 200 acres of farmland at the city's edge. Is Tolvany Fields an example of infilling?
Which reason supports your answer?
Part 5 Explain it Explain a city's housing pattern
Nothing you type leaves this page. Check your answer against the model and each scoring point.
Free response is 50% of the exam score. This one is shaped like Question 1, from free-response II.
Free-response practice · Question 1 style
Answer each part about housing and residential land use in cities.
(A) Identify one characteristic of low-density housing.
(B) Describe one difference between medium-density and high-density housing.
(C) Explain how a change in transportation technology changed the density of the housing built at a city's edge.
(D) Explain how a cultural value can be reflected in a city's residential land use.
(E) Describe how cycles of development can leave a city with areas of housing of different ages and densities.
(F) Explain how infilling changes the housing density of a built-up neighborhood.
(G) Explain one way a low-density pattern, once built, shapes how the people who live there travel.
Model answer
(A) Low-density housing is detached single-family houses, each on its own lot with a private yard.
(B) Medium-density housing, such as townhouses, duplexes and apartment buildings of two to four floors, puts a few homes on a small lot without elevators. High-density housing stacks many homes in buildings many floors tall, reached by elevators, so far more homes stand on each acre.
(C) When most households bought cars and highways were built, people no longer had to live within walking distance of work or near a streetcar line. Builders could put homes on land far from the center, on large lots, so the housing built at the edge in the car era was much lower in density than the housing of earlier eras.
(D) Where owning a detached house with a private yard is a widely shared goal, builders put up low-density subdivisions and voters back zoning laws that allow only detached houses on most blocks, which writes that value into the land.
(E) A city grows in waves of building separated by slowdowns. Each wave builds with its own era's technology and tastes, and the buildings last, so the city ends up with areas of housing of different ages: older, denser housing from the walking and streetcar eras near the center, and newer, lower-density housing from the car era farther out.
(F) Infilling puts new homes on vacant or underused land inside the neighborhood, such as a parking lot. The number of homes rises while the land area stays the same, so the neighborhood's density rises.
(G) In a low-density suburb, stores, schools and jobs are too far apart to walk to, and too few people live along any route to support frequent buses, so residents depend on cars for most trips.
Score your own answer. This is a self-check, not a grade. Tick each point your answer makes.
Part 6 Check yourself The rings of City W
The case questions use the table. The others mix the ideas from the whole lesson.
Hypothetical City W grew outward from its center in four rings. Its planning office counted the housing in each ring in 2015. Between 2015 and 2025, builders added 1,500 apartments on former warehouse sites and parking lots inside Ring 1.
| Ring | Distance from center | Most housing built | Housing units | Acres of land |
|---|---|---|---|---|
| 1 | 0 to 2 km | 1890s to 1920s | 6,000 | 200 |
| 2 | 2 to 5 km | 1920s to 1940s | 9,000 | 600 |
| 3 | 5 to 9 km | 1950s to 1980s | 8,000 | 2,000 |
| 4 | 9 to 14 km | 1990s to 2010s | 7,500 | 3,000 |
Case question 1 · Calculate
In 2015, how many times as many housing units per acre did City W's Ring 1 have as its Ring 4?
Case question 2 · Multiple choice
Which statement best explains the pattern of housing density across City W's four rings in 2015?
Case question 3 · Multiple choice
Which term and effect describe the 1,500 apartments built in City W's Ring 1 between 2015 and 2025?
The rest stand on their own and do not use the case.
Check yourself · Spot the error
A student explains the housing pattern in the newest suburb of hypothetical City N. Which line is the first to go wrong?
Check yourself · Select all
Which two observations show a culture's values reflected in a hypothetical city's residential land use? Select two.
Select 2 answers, then check.
Part 7 Keep it Bring back earlier ideas
Two questions from earlier Unit 6 lessons.
From 6.5 The Internal Structure of Cities · Sort it
Each card describes part of a hypothetical city. Tap a card, then the model it shows best.
Burgess concentric-zone model
Hoyt sector model
Harris and Ullman multiple-nuclei model
From 6.3 Cities and Globalization · Put it in order
Put these steps in the order a global process reaches the farmers near hypothetical Town E, in hypothetical Country P.
In three lines
- Housing density is homes per acre: detached houses are low density, attached and low-rise homes medium, and apartment towers high.
- Housing reflects the culture and technology of the era that built it, then shapes how residents live and travel.
- Cycles of development layer a city's housing by age, and infilling adds homes on unused land inside the city, raising density.
Exam strategy for this topic
- Section I, Multiple Choice: 60 questions in 60 minutes.
- Section II, Free Response: 3 questions in 75 minutes.
When a question gives housing data, divide housing units by land before you compare places. Then tie each density to a cause: the technology or culture of the era that built it, or later infilling.
Questions students ask
What counts as low, medium or high density?
There is no single cutoff that every city uses. Describe the buildings (detached houses, attached and low-rise homes, or tall apartment buildings) and the homes per acre. This lesson's hypothetical examples put detached houses at about 4 homes per acre or fewer and towers at about 50 to 60.
Is high density the same as overcrowding?
No. Density counts homes per acre of land. Overcrowding is about too many people inside one home. A tower of roomy apartments is high density without being crowded.
Why is housing near a city's center often older and denser?
Many cities grew outward in cycles of development. The center was built first, when people walked or rode streetcars to work and homes had to be close together; later rings were built for cars, on larger lots. Later rebuilding and infilling can break the pattern.
How is infilling different from sprawl?
Infilling builds on vacant or underused land inside the built-up area and raises density there. Sprawl spreads low-density housing outward onto open land at the edge.
Are the places in this lesson real?
No. Every city, neighborhood and number here is hypothetical, chosen to show each idea clearly. Real cities show these patterns more loosely.
Course alignment, for teachers
AP Human Geography topic 6.6, Unit 6: Cities and Urban Land-Use Patterns and Processes.
- Skill 3.D: Compare patterns and trends in maps and in quantitative and geospatial data to draw conclusions.
This lesson maps the one essential knowledge statement of the topic to the part that teaches each one: 1 is checked by a scored question. The map is in the lesson file.