Unit 6 · Topic 6.7 · about 30 minutes · 7 parts · 12 scored checks, 3 of them multiple choice, plus 2 from earlier lessons
AP Human Geography 6.7: Infrastructure
Unit 6: 12 to 17% of the multiple-choice section
What you'll be able to do
- Explain how the location and quality of a city's infrastructure, and the local political choices behind it, shape the city's patterns of economic and social development, its residents' lives and its environment.
Key vocabulary
| Term | What it means | The exam trap |
|---|---|---|
| Infrastructure | The shared physical systems a city runs on, including transportation, water and sewer, power, communication networks and public facilities such as schools. | It includes networks people rarely see, such as pipes and cables, not only roads and buildings. |
| Spatial pattern | The way something is arranged across space: where it is found, where it is not, and how it changes from place to place. | Describe the arrangement across the whole map before you explain it, not one place on its own. |
| Economic development | Growth in a place's jobs, businesses, investment and incomes. | A district can gain people without gaining jobs or investment, so count both. |
| Social development | Improvement in people's well-being, such as their health, education, safety and access to services. | It is measured in people's lives, so a new building alone does not show it. |
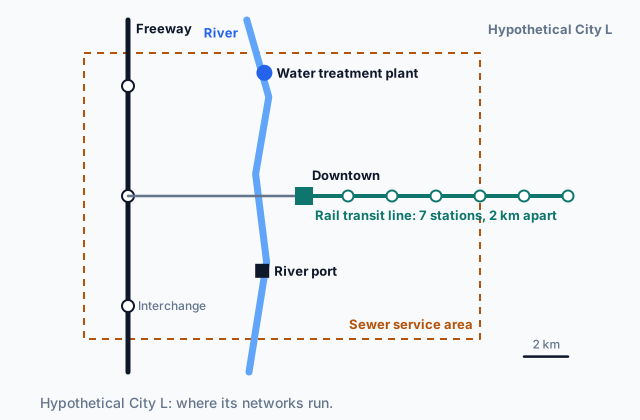 Tap to open the picture full size
Part 1 Think first Where will the builders go?
Commit to a guess first. Being wrong now makes the right idea stick better.
Predict first
A hypothetical city opens a new rail transit line that runs 10 km from downtown to the city's edge, with a station every 2 km. Builders and businesses can buy land anywhere along it. Ten years later, where along the line would you expect most of the new offices, shops and apartments to be?
In short. A city's infrastructure is the shared physical systems it runs on, from roads and transit to water, sewer, power and internet lines, and where it runs and how well it works directly shape where the city's jobs, investment, health and services end up.
- Location: firms, offices and housing cluster where infrastructure gives access, such as near transit stations, highway interchanges, ports and the reach of water and sewer mains.
- Quality: districts on the same networks still diverge when one has reliable water, power, internet and transit and another has broken or aging systems.
- Infrastructure is placed and repaired by local political decisions, and it shapes residents' access to jobs and services and the pollution, heat and flooding they live with.
Part 2 Learn it How infrastructure shapes a city
2a. Where infrastructure runs
A city's infrastructure is the shared physical systems that people and businesses depend on: transportation (streets, highways, bus and rail transit, ports, airports), utilities (water mains, sewers, power lines, and communication networks such as broadband) and public facilities such as schools and clinics.
The location of infrastructure shapes where development happens. A firm that ships goods wants to be near a highway interchange or a port. An office wants a site its workers can reach. A builder can put up an apartment block only where water and sewer mains reach. Land with that access is worth more, so jobs, investment and housing gather along the networks and thin out away from them.
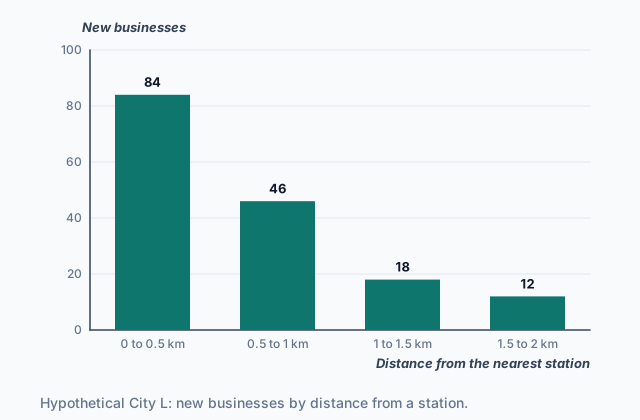
The chart shows hypothetical City L, the city on the map at the top of the page, in the ten years after it opened its rail line.
 Tap to open the picture full size
Most new businesses opened close to a station, and the count falls with each step away. Networks also work together: only 9 of the 160 opened near the two easternmost stations, which lie beyond the sewer service area on the map. The line did not only serve the city's old pattern; it made a new one. That is a spatial pattern of economic development: where jobs, firms and investment are found across the city, and where they are not.
Quick check · Calculate
A new highway in a hypothetical city has four interchanges. In the ten years after it opened, 2,400 new jobs came to land along it: 1,500 within 1 km of an interchange, 600 between 1 and 3 km from one, and 300 more than 3 km from any interchange. What percent of the new jobs were within 3 km of an interchange?
2b. Quality, not only location
Two districts can sit on the same networks and still be served very differently. The quality of infrastructure is how well it works: whether the water is safe and steady, whether the power stays on, how fast and reliable the internet is, how often the bus comes, whether roads and bridges are kept in repair.
Poor quality shows up on the map. A factory that loses power every week, or a shop whose street floods after every storm, moves to a district where things work, or never opens at all. Families who can choose move toward clean water, good schools and transit that runs on time, and the districts they leave lose customers and taxpayers.
Take two neighborhoods of a hypothetical city, 3 km apart. Both have water mains, a bus route and broadband. In one, the mains are new and the buses come every 10 minutes. In the other, mains laid 90 years ago break several times a year and the bus comes once an hour. On a map that shows only where the networks run, the two look the same. On a map of new businesses, health and school results, they do not.
That second set of outcomes is social development: people's health, education, safety and access to services. Uneven location and uneven quality both leave the same kind of mark: some districts gain jobs, investment and services, and others fall behind.
Quick check · Sort it
Each card describes the infrastructure of a district in a hypothetical city. Sort it by whether it is about where the infrastructure is (its location) or how well the infrastructure there works (its quality).
Location of infrastructure
Quality of infrastructure
2c. Who decides: infrastructure and local politics
Infrastructure is built and repaired by decisions, most of them local. A city council or a regional agency chooses where a new transit line runs, which pipes are replaced first and which streets are repaved, and voters approve or reject the bonds and taxes that pay for them. So a map of a city's infrastructure is partly a map of political power.
Districts with many active voters, organized business groups or wealthy residents can press for upgrades, or block a project they do not want next to them, such as a freeway or a waste plant. Districts with less political voice are more likely to receive those projects and less likely to get repairs. In the twentieth century many cities routed new freeways through low-income and minority neighborhoods, splitting them apart; Topic 6.10 returns to housing discrimination.
Local funding can add a loop. Picture a hypothetical city that pays for much of each district's upkeep from that district's own property taxes. A district with valuable land collects more, keeps its infrastructure in better shape, draws more investment, and so raises its land values again. A district with a small tax base falls further behind with every cycle. The same infrastructure decisions that follow political power can also build it.
Quick check · Put it in order
In a hypothetical city, each district's infrastructure upkeep is paid partly from that district's own property taxes. Put these events in the order that shows how a well-served district can pull further ahead.
2d. Infrastructure, society and the environment
Infrastructure also decides who can reach what. A household without a car depends on transit to get to jobs, clinics and grocery stores. If no bus reaches an industrial park, its jobs are out of reach for those households even when the park is only a few kilometers away. Where a city builds schools, clinics and parks shapes social development on the map just as transit does.
The environment is part of the same picture. Highways, ports, rail yards and power plants bring noise and air pollution to the homes beside them. Old combined sewers, which carry stormwater and wastewater in the same pipes, overflow into rivers in heavy rain. Streets with few trees and little green space get hotter in summer than shaded ones. Districts with storm drains too small for heavy rain flood more often, and flooding damages homes and keeps investment away.
Cities also use infrastructure to change a pattern: a new bus line to an industrial park, street trees and parks in a hot district, separate pipes for stormwater so the sewers stop overflowing. Which district gets such a project first is, again, a local political decision.
Quick check · Multiple choice
In a hypothetical city, District R sits on low ground along a river, and its storm drains are old and too small for heavy rain. District S, on higher ground, has new storm drains. Over the next twenty years, which difference between the districts is most likely?
Part 3 Watch it done What did the sewer mains change?
Watch each step, then do the last one yourself.
Hypothetical Town M extended water and sewer mains to the east side of town in 2015, but not to the west side. Before then neither side had them, and homes used wells and septic tanks. New-home building permits on the east side: 50 in 2014 and 400 in 2024. On the west side: 60 in 2014 and 75 in 2024. Compare how much building grew on each side, and say what the pattern suggests.
Predict first
Before the steps, how do you expect the two sides of Town M to compare?
Step 1 · Start from before the mains
In 2014 the two sides were close: 50 permits on the east side and 60 on the west. Two places that start near the same level make a later gap worth explaining.
Step 2 · Work out the east side's growth
400 ÷ 50 = 8. The east side issued 8 times as many permits in 2024 as in 2014.
Why this step?
Why compare each side with its own 2014 number instead of only comparing the two sides in 2024?
A gap in 2024 alone might have been there all along. Comparing each side with its own starting point shows how much it changed, and the west side, which got no mains, shows roughly what would have happened without them.
Your step · Calculate
Finish it. In hypothetical Town M, the west side, which got no water or sewer mains, issued 60 new-home building permits in 2014 and 75 in 2024. How many times as many permits did the west side issue in 2024 as in 2014?
times
The east side issued 8 times as many permits; the west side, 1.25 times as many, a rise of a quarter. Most new homes need piped water and sewer, so where the mains ran set where building could happen. The data fit that link. A strong answer also names something else that could differ between the two sides, such as land prices or road access, because two numbers cannot rule everything else out.
Part 4 Try it Plan for a city's districts
Try it · Decide and justify
Hypothetical City K's industrial park, 8 km south of downtown, has 1,200 open jobs. The city can afford one new express bus route to the park, and its goal is to bring the park within a 45-minute trip for as many residents without a car as it can. District 1 has 30,000 residents; 40% of its households have no car, and today's bus trip to the park takes 95 minutes. District 2 also has 30,000 residents; 5% of its households have no car, and the drive to the park takes 20 minutes. Which district should the new route serve?
Which reason supports your answer?
Try it · Fill the statement
A planner compares two neighborhoods of a hypothetical city. Complete the planner's note.
Neighborhoods P and Q have the same streets, the same bus route and the same number of water mains per block. Neighborhood P's mains were replaced last decade; Neighborhood Q's are 80 years old and break often. The difference between them is one of . Shops and families who can choose where to go are likely to move toward Neighborhood , and over time Neighborhood Q's tax base would .
Part 5 Explain it Explain two districts of a city
Nothing you type leaves this page. Check your answer against the model and each scoring point.
Free response is 50% of the exam score. This one is shaped like Question 3, from free-response II.
Free-response practice · Question 3 style
Stimulus 1, a hypothetical map: In hypothetical City X, a rail transit line runs 10 km north from downtown to District N, with five stations. No rail line serves District E, east of downtown. A freeway built in the 1960s runs through the middle of District E, with homes on both sides of it, and the district's two main streets were cut where the freeway crosses them.
Stimulus 2, hypothetical data for the two districts of City X: - Households with no car: District N 20%, District E 45% - Average trip to downtown jobs by public transit: District N 25 minutes, District E 70 minutes - Hospital visits for childhood asthma, per 1,000 children each year: District N 6, District E 15 - New businesses opened last year: District N 60, District E 9
(A) Identify one type of infrastructure shown in Stimulus 1.
(B) Using Stimulus 2, describe the difference in public transit trip times between District N and District E.
(C) Using both stimuli, explain how the location of the rail line helps explain the difference you described in (B).
(D) Explain why District E's share of households with no car makes the difference in trip times matter more for its residents' access to jobs.
(E) Using one figure from Stimulus 2, explain one way the freeway could affect the environment and health of District E.
(F) Explain one way local politics can shape where a city places infrastructure such as a freeway.
(G) Explain one limitation of using Stimulus 2 alone to conclude that the freeway caused District E's higher rate of asthma visits.
Model answer
(A) The rail transit line (also accepted: the freeway or the main streets).
(B) A public transit trip to downtown jobs takes 70 minutes from District E, nearly three times the 25 minutes from District N.
(C) The rail line runs to District N, with five stations, so its residents can ride a fast, direct line downtown. District E has no rail line, so its residents must rely on slower ways to reach downtown, which is why their trips take far longer.
(D) In District E, 45% of households have no car, more than twice District N's share. Those residents cannot drive around the slow trip, so a 70-minute commute limits which jobs they can take, and fewer of them can reach downtown's jobs at all.
(E) The freeway brings heavy traffic, and its exhaust pollutes the air in the homes beside it. That fits District E's 15 asthma hospital visits per 1,000 children, more than twice District N's 6.
(F) Districts whose residents have more political power, through votes, money or organized groups, can push a project like a freeway away from their homes, so it is more likely to be built through a district with less political voice, where land is also cheaper.
(G) Stimulus 2 shows only that District E has more asthma visits and a freeway, not that one caused the other. Other differences, such as older housing with mold, factories nearby, or lower incomes and less access to clinics, could also raise the rate, and the data do not show what the rate was before the freeway was built.
Score your own answer. This is a self-check, not a grade. Tick each point your answer makes.
Part 6 Check yourself The districts of City W
The case questions use the table. The others mix the ideas from the whole lesson.
Hypothetical City W's planning office surveyed its four districts, each with about 50,000 residents. Every figure is invented for this lesson.
| District | Homes with piped water and sewer | Homes with broadband | Transit trip to the main job center | New businesses per year |
|---|---|---|---|---|
| Central | 99% | 94% | 15 minutes | 140 |
| Riverside | 96% | 88% | 25 minutes | 90 |
| Hillside | 72% | 51% | 55 minutes | 20 |
| Southfield | 48% | 30% | 80 minutes | 8 |
Case question 1 · Multiple choice
Which conclusion about City W do the data best support?
Case question 2 · Calculate
In City W, how many times as many new businesses per year does Central gain as Southfield?
Case question 3 · Multiple choice
City W extends water and sewer mains across Southfield and opens a rapid bus line with stops through it, cutting the transit trip to the main job center to 30 minutes. If nothing else changes, which result over the next 15 years is most likely?
The rest stand on their own and do not use the case.
Check yourself · Spot the error
A student explains how road repairs are paid for in a hypothetical city. Which line is the first to go wrong?
Check yourself · Match
Each condition describes infrastructure in a district of a hypothetical city. Match each condition to the outcome it most directly produces for the district's residents or environment.
Part 7 Keep it Bring back earlier ideas
This lesson stands on density and land use from Topic 6.6 and the internal structure of cities from Topic 6.5.
From 6.6 Density and Land Use · Match
In a hypothetical city, each change in transportation or building technology made a new pattern of housing possible. Match each change to the pattern it made possible.
From 6.5 The Internal Structure of Cities · Match
Match each model of a city's internal structure to the feature it is known for.
In three lines
- Location: jobs, investment and housing gather where infrastructure gives access, such as near stations, interchanges, ports and the reach of water and sewer mains.
- Quality: reliable water, power, internet and transit draw development, and aging or broken systems push it away, even in districts on the same networks.
- Local politics decides where infrastructure goes and what gets repaired, and infrastructure shapes residents' access to jobs and services and the pollution, heat and flooding they face.
Exam strategy for this topic
- Section I, Multiple Choice: 60 questions in 60 minutes.
- Section II, Free Response: 3 questions in 75 minutes.
When a map or table shows infrastructure and development side by side, describe the pattern first (where the networks run, where jobs and services are), then explain the link through location or quality, and name one other factor that could also explain what you see.
Questions students ask
What counts as a city's infrastructure?
The shared physical systems the city runs on: streets, highways, transit, ports and airports; water and sewer mains, power lines and communication networks such as broadband; and public facilities such as schools, clinics and parks.
What is the difference between the location and the quality of infrastructure?
Location is where a network runs and which places it reaches. Quality is how well it works there: how reliable the water and power are, how fast the internet is, how often the bus comes, how well roads and bridges are kept up. A district can be reached by every network and still be held back by poor quality.
Does new infrastructure guarantee development?
No. It gives land new access, which makes development possible and more likely, but builders and businesses also weigh land prices, demand, safety and other conditions. That is why a careful answer about a pattern names more than one factor.
Why does local politics matter for infrastructure?
Councils, agencies and voters decide where projects go, which repairs come first, and how they are paid for. Districts with more political voice can win upgrades and push away unwanted projects, so the map of infrastructure partly reflects who holds power in the city.
Are the cities and numbers in this lesson real?
No. Every city, town, district and number here is hypothetical, chosen to show each idea clearly. Real cities show these patterns too, but less neatly.
Course alignment, for teachers
AP Human Geography topic 6.7, Unit 6: Cities and Urban Land-Use Patterns and Processes.
- Skill 3.C: Explain patterns and trends in maps and in quantitative and geospatial data to draw conclusions.
This lesson maps the one essential knowledge statement of the topic to the part that teaches each one: 1 is checked by a scored question. The map is in the lesson file.