Unit 6 · Topic 6.8 · about 30 minutes · 7 parts · 12 scored checks, 3 of them multiple choice, plus 2 from earlier lessons
AP Human Geography 6.8: Urban Sustainability
Unit 6: 12 to 17% of the multiple-choice section
What you'll be able to do
- Identify the urban design initiatives and zoning practices meant to make cities sustainable: mixed land use, walkability, transportation-oriented development, and smart-growth policies such as New Urbanism, greenbelts and slow-growth cities.
- Explain the effects of these initiatives, both the praise they earn and the criticisms they draw, and use before-and-after data to judge a plan.
Key vocabulary
| Term | What it means | The exam trap |
|---|---|---|
| Zoning | Local rules that set what the land in each district may be used for and what may be built there. | Zoning can keep uses apart or let them mix, so read which kind a question describes. |
| Mixed land use | Different uses, such as homes, shops, offices and schools, sharing the same district, block or building. | Look at what shares a block or building, not at the name a district is zoned under. |
| Walkability | How easily people can reach their daily needs on foot. | Judge it by the route a person would actually walk along the streets, not by a straight line on a map. |
| Transportation-oriented development | Dense, mixed building within a short walk of a transit station, also called transit-oriented development. | Name the transit station when you describe it; dense building on its own is not enough. |
| Smart-growth policies | Policies that steer a city to grow inward and upward, near services it already has, more than outward onto open land. | It is a family of policies, so name the specific one a question describes. |
| New Urbanism | A design movement that builds compact, walkable neighborhoods on the pattern of older towns, with mixed uses and a mix of housing. | It is a way of designing neighborhoods, so describe the layout, not only the goal. |
| Greenbelt | A band of farms, forest or parks around a city where new subdivisions are not allowed. | On a map, the belt is the open land outside the built-up line, not the city inside it. |
| Slow-growth city | A city that limits how fast it grows, for example with a yearly cap on building permits. | A slow-growth city still grows, so do not read it as a ban on new homes. |
| Sprawl | Low-density building that spreads outward onto open land at a city's edge. | Sprawl is a pattern of land use, so look at where and how densely a city builds, not only at its population. |
| De facto segregation | Separation of groups, such as by income, race or ethnicity, that happens in fact, without any law requiring it. | Say which groups end up apart and what keeps them apart. |
| Place character | What makes a place distinct: its older buildings, streets and local businesses and the sense of place they give. | Say what made the place recognizable before you judge what new building changed. |
 Tap to open the picture full size
Part 1 Think first Who complains about the new district?
Commit to a guess first. Being wrong now makes the right idea stick better.
Predict first
Hypothetical City J replaces an old rail yard near its downtown with a new neighborhood: apartments over shops, a park, a tram stop and wide sidewalks. Planners call it a success. Five years later, which group is most likely to be complaining about it?
In short. Urban sustainability initiatives use design and zoning, such as mixed land use, walkability, transportation-oriented development and smart-growth policies including New Urbanism, greenbelts and slow-growth cities, to steer how a city grows, and each draws both praise and criticism.
- Mixed land use puts homes, shops, jobs and schools close together, and walkability is how easily people reach those daily needs on foot; transportation-oriented development builds densely within a short walk of a transit station.
- Smart-growth policies steer growth inward: New Urbanism designs compact, walkable neighborhoods, a greenbelt limits where a city may build, and a slow-growth city limits how fast it builds.
- Supporters praise less sprawl, better walking and transit, more varied housing, better livability and more sustainable options; critics point to higher housing costs, possible de facto segregation and the loss of historical or place character.
Part 2 Learn it Designing cities to grow sustainably
2a. Mixed land use and walkability
Zoning is the set of local rules that says what each piece of land may be used for and what may be built on it. Many suburbs use single-use zoning: one district for houses, another for stores, another for offices. Each use sits apart from the others, and getting from one to another usually means driving.
Mixed land use lets different uses share a district, a block or even one building: apartments over a grocery, offices beside a school. Walkability is how easily people can reach their daily needs on foot. It takes two things together: places to walk to that are close by, and connected streets and sidewalks that lead there.
 Tap to open the picture full size
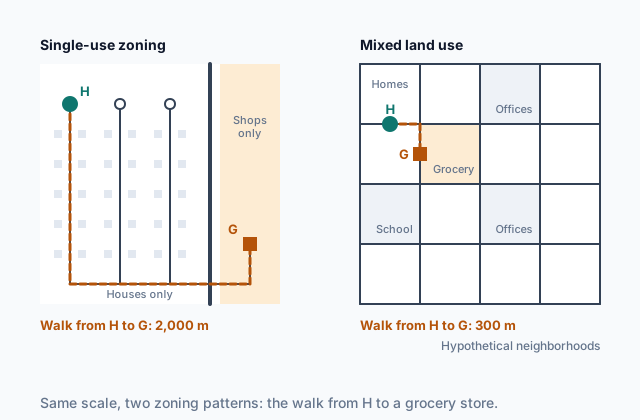
Both neighborhoods in the figure are drawn at the same scale. On the left, the dead-end streets and the shops-only district turn a trip to the grocery into a 2,000 m walk, so most people drive it. On the right, mixed land use puts a grocery on the next block, and the street grid gives a direct route: 300 m. Rezoning a single-use district for mixed land use is one of the zoning practices cities use to make trips on foot practical again.
Quick check · Multiple choice
In a hypothetical suburb, zoning keeps houses, stores and offices in separate districts, and most homes are a 4 km drive from the nearest grocery store. The town rezones its main street so that stores, offices and apartments can share the same buildings. What is this zoning change designed to do?
2b. Transportation-oriented development
Transportation-oriented development, also called transit-oriented development, builds homes, offices and shops close together, at higher density, within a short walk of a rail or bus station. In this lesson a short walk means 800 m or less, about ten minutes on foot. People who live and work near a station can ride transit for long trips and walk for short ones, so fewer trips need a car.
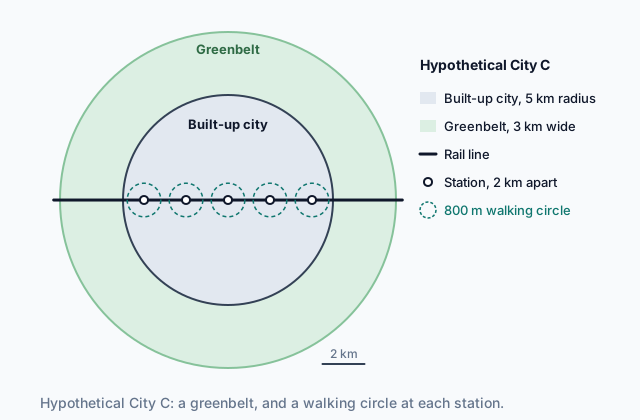
The map at the top of the page shows hypothetical City C. Each of its five stations sits inside an 800 m walking circle, and together the five circles cover only about 13 percent of the built-up city. A plan that steers new homes and jobs into those circles lets many more people use the rail line without spreading the city outward.
Transportation-oriented development works with mixed land use: a station area of nothing but apartments still sends its residents somewhere else for groceries. What sets it apart from other walkable design is its anchor, the transit station.
Quick check · Calculate
A hypothetical city plans 5,000 new homes for transportation-oriented development along a new rail line. Of them, 2,400 are within 400 m of a station, 1,600 are between 400 m and 800 m from a station, and 1,000 are farther than 800 m. Taking a short walk as 800 m or less, what percent of the new homes are within a short walk of a station?
2c. Smart-growth policies
Smart-growth policies guide where and how fast a city grows, so that it grows inward and upward, near roads, transit and services it already has, more than outward onto open land. Three kinds matter here.
New Urbanism is a design movement. Its neighborhoods copy older town patterns: compact blocks, narrow streets, houses with porches close to the sidewalk, a mix of house sizes and apartments, and shops, a school and a park within a walk of every home.
A greenbelt is a band of land around a city kept as farms, forest or parks, where new subdivisions are not allowed. It controls where the city may grow: new building has to happen inside the line. The map at the top of the page shows one around City C.
A slow-growth city limits how fast it grows, for example by capping the number of building permits it issues each year, or by approving new homes only once the roads, schools and water lines they need are ready.
A greenbelt sets a boundary; a slow-growth policy sets a pace. New Urbanism is about how a neighborhood is laid out. A city can use all three at once.
Quick check · Match
Each observation comes from a different hypothetical city. Match each smart-growth policy to the observation that shows it.
2d. Praise and criticism
Supporters praise these initiatives for:
- reduction of sprawl, as growth goes into infill and station areas instead of onto farmland at the edge;
- improved walkability and transportation, with more trips made on foot, by bike and by transit;
- improved and diverse housing options, as apartments, townhouses and small houses join single-family homes;
- improved livability: parks, quieter streets and daily needs close at hand;
- promotion of sustainable options, such as less driving, less fuel burned and less open land paved.
Critics point to three problems:
- increased housing costs. A walkable district with transit draws people who will pay more to live there, and when a plan lets housing grow more slowly than the number of people who want it, prices and rents climb;
- possible de facto segregation. When rising costs push lower-income households out, a district can end up divided by income, and with it by race or ethnicity, though no law requires it. De facto means in fact, as opposed to by law;
- the potential loss of historical or place character, when older buildings are torn down for new ones that look like new buildings anywhere.
Quick check · Sort it
Each card describes an outcome after a hypothetical city adopted an urban design initiative. Tap a card, then say whether it supports praise for the initiative or a criticism of it.
Supports praise
Supports a criticism
Part 3 Watch it done Weigh a station plan in City V
Watch each step, then do the last one yourself.
Hypothetical City V rezoned the blocks within 800 m of a new rail station for mixed land use at higher density. Its planners compared the station area before the plan with the same area eight years later, using invented numbers: residents who drive to work fell from 68 percent to 51 percent, and the median monthly rent rose from 1,200 dollars to 1,500 dollars. Name the initiative, then use the data for one praise and one criticism of it.
Step 1 · Name the initiative
Dense, mixed building within a short walk of a transit station is transportation-oriented development, built on mixed land use.
Step 2 · Read the praise from the data
Driving to work fell from 68 percent to 51 percent of residents, a drop of 17 percentage points. More residents walk or take the train, which is the improved transportation and the promotion of sustainable options that supporters praise.
Why this step?
Why compare the station area with itself before the plan, instead of with an outer suburb today?
Comparing one place over time holds its location and much of its population steady, so a change is more likely to come from the plan. An outer suburb differs from a station area in many ways besides the plan, so a gap between them could have other causes.
Your step · Calculate
Finish it with the criticism. By what percent did the median monthly rent in City V's station area rise, from 1,200 dollars before the plan to 1,500 dollars after it?
percent
Part 4 Try it Predict what a plan does
Try it · Decide and justify
Hypothetical County G draws a greenbelt around its main city and allows no new subdivisions in it. The county's population is expected to keep growing for the next fifteen years, and the rules for building inside the city stay the same. What will most likely happen to home prices inside the greenbelt line?
Which reason supports your answer?
Try it · Rank it
Hypothetical City K is choosing among three growth plans for the next decade. Each plan builds its new homes either as infill, on land inside the city that is already built up, or on farmland at the city's edge, and every edge home is built at the same low density. Rank the plans by how much they reduce sprawl. Work out the number of edge homes in each plan before you rank.
Least sprawl first
Give each one a place, 1 for first. Give two the same place if they are equal.
Your ranking: none yet
Part 5 Explain it Judge a smart-growth plan from its data
Nothing you type leaves this page. Check your answer against the model and each scoring point.
Free response is 50% of the exam score. This one is shaped like Question 2, from free-response II.
Free-response practice · Question 2 style
Stimulus, a table of hypothetical data for City R, comparing the ten years before it adopted a smart-growth plan with the ten years after. The plan drew a greenbelt around the city and rezoned the land around three rail stations for mixed land use at higher density.
Farmland built over at the city's edge each year: 400 hectares before, 90 hectares after.
Share of commutes made by car: 74 percent before, 58 percent after.
Share of new homes that are apartments or townhouses: 15 percent before, 55 percent after.
Median monthly rent near the three stations: 1,100 dollars before, 1,650 dollars after.
(A) Identify the policy in City R's plan that limits where the city can grow.
(B) Define transportation-oriented development.
(C) Using the data, describe one change that supports praise for the plan.
(D) Using the data, explain one criticism of the plan.
(E) Explain how the plan could lead to possible de facto segregation.
(F) Describe how rezoning near the stations could lead to the loss of historical or place character in an older district.
(G) Explain how adding a slow-growth policy, such as a yearly cap on building permits, could affect housing costs in City R.
Model answer
(A) The greenbelt, a band of open land around City R where new subdivisions are not allowed.
(B) Transportation-oriented development is building homes, offices and shops at higher density within a short walk of a transit station, so residents can walk or ride transit instead of driving.
(C) Farmland built over each year fell from 400 hectares to 90 hectares. That is a reduction of sprawl: growth went into the city and its station areas instead of onto open land at the edge.
(D) Median rent near the stations rose from 1,100 dollars to 1,650 dollars a month, a 50 percent rise. Critics say the plan increased housing costs: the greenbelt limits the land for new homes, and the walkable station areas draw renters and buyers who bid prices up.
(E) As rents rise, lower-income households can no longer afford to stay near the stations and move to cheaper districts. The station areas fill with higher-income households, so the city becomes divided by income, and often by race or ethnicity, though no law separates anyone. That is de facto segregation.
(F) Higher-density zoning makes the land under old, low buildings worth more as sites for new apartment and office blocks. Owners tear the old buildings down, and the new ones look like buildings in any other city, so the district loses what made it distinct.
(G) A cap on building permits holds the number of new homes below what a growing number of households wants, on top of the greenbelt's limit on land. With supply growing more slowly than demand, buyers and renters compete for fewer homes, so rents near the stations would likely rise even faster. That strengthens the criticism of increased housing costs.
Score your own answer. This is a self-check, not a grade. Tick each point your answer makes.
Part 6 Check yourself The districts of City Z
The case questions use the table. The others mix the ideas from the whole lesson.
Hypothetical City Z adopted a plan five years ago. It drew a greenbelt around the city and rezoned the blocks around two new rail stations, in Districts 1 and 2, for mixed land use at higher density. District 1 was an old mill district of brick buildings. Districts 3 and 4 have no station. Every number in the table is invented.
| District | Rail station | Median monthly rent (dollars) | Residents who walk, bike or ride transit to work | Buildings from before 1925 still standing |
|---|---|---|---|---|
| 1 | Yes | 900, then 1,350 | 22%, then 41% | 60, then 25 |
| 2 | Yes | 1,000, then 1,300 | 18%, then 37% | 4, then 4 |
| 3 | No | 950, then 1,000 | 15%, then 16% | 30, then 30 |
| 4 | No | 1,100, then 1,240 | 8%, then 9% | 0, then 0 |
Case question 1 · Multiple choice
Taken together, the data for Districts 1 and 2 most directly support which praise and which criticism of City Z's plan?
Case question 2 · Calculate
What percent of District 1's buildings from before 1925 were lost in the five years after the plan?
Case question 3 · Multiple choice
In City Z, rents rose much faster in Districts 1 and 2 than in Districts 3 and 4. If that pattern goes on, which outcome do critics of plans like City Z's warn about?
The rest stand on their own and do not use the case.
Check yourself · Spot the error
A student judges the walkability of a hypothetical suburb. Which line is the first to go wrong?
Check yourself · Fill the statement
Complete the description of a hypothetical city's plan.
City Q packs its new apartments and offices into the blocks closest to each stop on its new tram line, and almost nothing new goes farther out. The plan is an example of . One building has a pharmacy on the ground floor, a dentist upstairs and apartments above, so the area has . A resident can walk to the grocery, the school and the tram stop, so the area scores high on .
Part 7 Keep it Bring back earlier ideas
This lesson stands on Topic 6.7 and Topic 6.6.
From 6.7 Infrastructure · Sort it
Each card describes the infrastructure of a district in a hypothetical city. Sort it by whether it is about where the infrastructure is (its location) or how well the infrastructure there works (its quality).
Location of infrastructure
Quality of infrastructure
From 6.6 Density and Land Use · Fill the statement
Complete the description of a project in a hypothetical city.
A builder turns a surface parking lot near downtown into a ten-story apartment building. This project is an example of . The neighborhood's housing density , and the new homes use roads, pipes and transit lines that .
In three lines
- Mixed land use and walkability put daily needs within a short walk, and transportation-oriented development builds densely around transit stations.
- Smart-growth policies steer growth inward: New Urbanism designs the neighborhood, a greenbelt limits where a city builds, a slow-growth city limits how fast.
- Praise: less sprawl, better walking and transit, more varied housing, livability and sustainable options. Criticism: higher housing costs, possible de facto segregation, lost place character.
Exam strategy for this topic
- Section I, Multiple Choice: 60 questions in 60 minutes.
- Section II, Free Response: 3 questions in 75 minutes.
When a question asks for an effect of a design initiative, name the initiative, say which way it pushes something (sprawl, driving, rents), and tie that to a praise or a criticism by name. When it gives data, quote the before and after numbers you are using.
Questions students ask
Is transportation-oriented development the same as transit-oriented development?
Yes. Both names are used for the same idea: dense, mixed building within a short walk of a transit station. The AP course framework uses transportation-oriented development.
What is the difference between a greenbelt and a slow-growth city?
A greenbelt limits where a city may grow, with a band of open land that new subdivisions may not cross. A slow-growth city limits how fast it grows, with rules such as a yearly cap on permits. A city can use both.
Is New Urbanism a law?
No. It is a design movement, a way of laying out neighborhoods. A city can support it through zoning that allows mixed uses, narrow streets and smaller lots, but the idea is the design itself.
How can a plan praised for livability raise housing costs?
The things that make a district livable, such as parks, transit and shops close by, also make more people want to live there. If the number of homes grows more slowly than the number of people who want them, prices and rents rise.
Why is it called de facto segregation?
De facto means in fact. No law separates anyone; the separation comes from who can afford to live where. Separation required by law is called de jure.
Are the cities and districts in this lesson real?
No. Every city, county, district and number here is hypothetical, chosen to show each idea clearly. Real cities mix these initiatives in many ways.
Course alignment, for teachers
AP Human Geography topic 6.8, Unit 6: Cities and Urban Land-Use Patterns and Processes.
- Skill 2.C: Explain a likely outcome in a geographic scenario using geographic concepts, processes, models, or theories.
This lesson maps all 2 essential knowledge statements of the topic to the part that teaches each one: 2 are checked by a scored question. The map is in the lesson file.