Unit 7 · Topic 7.3 · about 30 minutes · 7 parts · 14 scored checks, 3 of them multiple choice
AP Human Geography 7.3: Measures of Development
Unit 7: 12 to 17% of the multiple-choice section
What you'll be able to do
- Describe the social and economic measures of development: GDP, GNP and GNI per capita, sectoral structure, formal and informal economies, income distribution, fertility, infant mortality, access to health care, energy use and literacy, and the Gender Inequality Index and Human Development Index.
Key vocabulary
| Term | What it means | The exam trap |
|---|---|---|
| Gross Domestic Product (GDP) | The value of all goods and services produced inside a country's borders in a year, whoever owns the business. | GDP, GNP and GNI each draw the line around a country's economy in a different place; learn which question each one answers. |
| Gross National Product (GNP) | The value of goods and services produced by a country's people and companies in a year, wherever they produce them. | GNP and GNI are close to each other, but neither is another name for GDP. |
| GNI per capita | A measure of the average income of a country's people, built from its gross national income. | It is an average, so it says nothing on its own about how income is shared. |
| Sectoral structure | The share of a country's workers, or of its output, in each economic sector, from farming and mining to manufacturing and services. | Say whether you mean the share of workers or the share of output; the two can differ. |
| Informal economy | Work that is not recorded, taxed or regulated by the government, such as unlicensed street selling or cash work with no contract. | Informal work turns up in every sector, from farming to services. |
| Income distribution | How a country's income is shared among its people, from the poorest to the richest. | Two countries can share the same average income and very different distributions. |
| Total fertility rate | The average number of children a woman has in her lifetime. | It counts births, so do not use it to describe how many babies survive. |
| Infant mortality rate | The number of babies who die before their first birthday for every 1,000 live births. | It is a rate per 1,000 births, not a total, so countries of very different sizes can be compared with it. |
| Literacy rate | The share of adults in a country who can read and write. | It is a share of adults, so it describes past schooling more than today's classrooms. |
| Human Development Index (HDI) | A United Nations composite measure that combines several measures of how people live into one number. | Learn which kinds of measures go into it; you are not asked to calculate it. |
| Gender Inequality Index (GII) | A United Nations measure of the gaps between women and men, built from several kinds of measures. | Read its scale carefully: it measures inequality, so the direction is the opposite of the HDI's. |
 Tap to open the picture full size
Part 1 Think first Which country is better off?
Commit to a guess first. Being wrong now makes the right idea stick better.
Predict first
Hypothetical Country A's economy produces $300 billion of goods and services a year, and 100 million people live there. Hypothetical Country B's economy produces $50 billion a year, and 5 million people live there. In which country do people have more income, on average?
In short. Geographers measure development with economic measures, such as GNI per capita, the mix of economic sectors and how income is shared, with social measures, such as fertility, infant mortality, access to health care, energy use and literacy, and with composite indexes that combine several measures into one number.
- GDP counts what is produced inside a country's borders; GNP and GNI count what a country's people and companies produce or earn, at home and abroad. Dividing GNI by the population gives GNI per capita, the average income per person.
- An average hides a lot: much of a large informal economy goes unrecorded, and an uneven income distribution can leave most people well below the average. Social measures such as infant mortality and literacy show how people actually live.
- The Human Development Index combines health, education and income to show how development varies among countries. The Gender Inequality Index measures gaps between women and men in reproductive health, empowerment and labor-market participation.
Part 2 Learn it How geographers measure development
2a. GDP, GNP and GNI per capita
Three economic measures add up the value of a country's economy in a year.
Gross Domestic Product (GDP) is the value of all goods and services produced inside a country's borders, whoever owns the business.
Gross National Product (GNP) is the value of goods and services produced by a country's people and companies, wherever they produce them. Gross National Income (GNI) measures the income those people and companies earn, at home and abroad. GNP and GNI come out close to each other.
The difference from GDP is ownership. Suppose foreign companies own many factories in hypothetical Country M. Their output is made inside Country M, so it counts in Country M's GDP. But their profits belong to owners abroad, so they do not count in Country M's GNI. Country M's GNI is smaller than its GDP.
A total is not a measure of how well people live, because a big total can be shared by a huge population. So geographers divide by the population. GNI per capita is GNI divided by the number of people: the average income per person. It is a widely used single number for comparing countries' economic development.
Quick check · Calculate
Hypothetical Country K has a GDP of $54 billion and a GNI of $48 billion. It has 6 million people. What is Country K's GNI per capita, in dollars?
2b. How the economy is built and shared
Geographers also look at how an economy is built and how its income is shared.
Sectoral structure is the share of workers, or of output, in each economic sector: farming, fishing and mining (primary), manufacturing (secondary), and services (tertiary and beyond). In a less developed economy a large share of people farm; in a more developed one most people work in services.
The structure also has a formal economy and an informal economy. Formal work is recorded, taxed and regulated, like a factory job on a payroll. Informal work is not, like a street vendor without a license or a farmhand paid in cash by the day. Much of what informal workers earn is missed by GDP and GNI, or only roughly estimated, and informal workers usually have no contract, pension or legal protection. Where the informal economy is large, the official figures miss much of how people make a living.
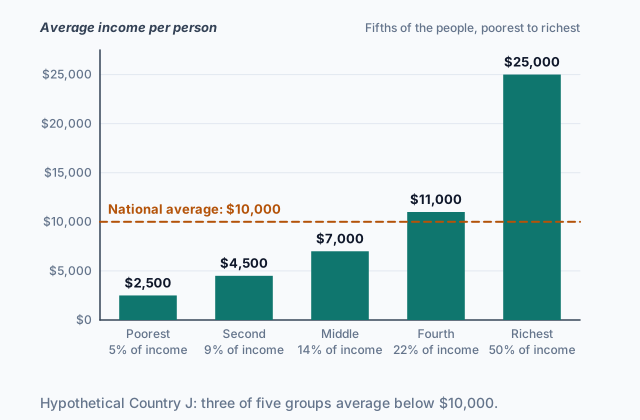
Income distribution is how a country's income is shared among its people. GNI per capita is an average. The chart at the top of the page splits hypothetical Country J's people into five equal groups. The national average is $10,000 per person, but the richest fifth receives half of all income, and three of the five groups average less than $10,000. The more unequal the distribution, the less the average says about a typical person.
Quick check · Sort it
Each card describes a worker in a hypothetical country. Tap a card, then the part of the economy it belongs to.
Formal economy
Informal economy
2c. Social measures
Income measures what people earn. Social measures show how they live, and geographers read several together.
The total fertility rate is the average number of children a woman has in her lifetime. It is high where families depend on farm labor and children's earnings, and it falls as more children survive and more girls stay in school.
The infant mortality rate is the number of babies who die before their first birthday for every 1,000 live births. A lower number means a better result. It is closely tied to access to health care: clinics, doctors, vaccines and clean water within reach of a family. Access to health care can be measured directly, too, as doctors or hospital beds for every 10,000 people.
The literacy rate is the share of adults who can read and write. It reflects how many people have had schooling.
Energy is a measure as well. Energy use per person rises as an economy develops, because factories, vehicles and homes all run on it. Where the energy comes from also matters: the share from fossil fuels, such as coal, oil and natural gas, against renewable energy, such as wind, solar and hydropower. That mix is not a simple ladder. A country with large rivers can get most of its electricity from dams at any level of income, so read the energy mix beside the other measures, never alone.
Quick check · Match
A survey of a hypothetical country reports four findings. Match each social measure of development to the finding that reports it.
2d. Composite measures: the HDI and the GII
Any one measure can mislead: a country with oil to sell can have a high GNI per capita while many children never finish school. Composite measures combine several measures into one number.
The Human Development Index (HDI), published by the United Nations, combines a measure of health, a measure of education and a measure of income. Because it adds health and education to income, two countries with the same GNI per capita can sit at different HDI levels. The HDI uses its own health and education measures. Infant mortality and literacy are not among them, but they point the same way, so they are good signs of where a country would stand. Mapped country by country, the HDI shows the spatial variation in development among states, the countries of the world.
The Gender Inequality Index (GII), also from the United Nations, measures the gaps between women and men in three kinds of measures:
- reproductive health, such as how many mothers die from causes tied to pregnancy and childbirth;
- empowerment, such as women's share of seats in the national legislature, and how many women have secondary schooling compared with men;
- labor-market participation, the share of women who work or seek paid work, compared with men.
Read the GII the other way around from the HDI: a higher GII means a wider gap between women and men, so a lower score is the better result.
Quick check · Fill the statement
Complete the description of the two composite measures.
The Human Development Index combines measures of , education and income, and a map of it shows how development varies among . The Gender Inequality Index compares women and men on reproductive health, empowerment and .
Part 3 Watch it done What the average hides
Watch each step, then do the last one yourself.
Hypothetical Country H has an average income of $6,000 per person. The richest tenth of its people receive 40% of the country's income, and the poorest half receive 10%. How many times as much income does the average person in the richest tenth receive as the average person in the poorest half?
Predict first
Before the steps, how far apart do you expect the two groups to be?
Step 1 · Compare each group's share of income with its share of people
If income were shared evenly, a tenth of the people would get a tenth of the income. The richest tenth gets 40%, which is 4 times its share of the people.
Step 2 · Turn that into dollars
So the average person in the richest tenth receives 4 times the national average: 4 × $6,000 = $24,000.
Why this step?
Why compare each group's share of income with its share of the people, instead of comparing 40% with 10% directly?
The two groups are different sizes. The poorest half is five times as many people as the richest tenth, so its 10% of income is spread across far more people.
Your step · Calculate
Finish it. Work out the average income per person in Country H's poorest half, then divide $24,000 by it. How many times as much income does the average person in the richest tenth receive as the average person in the poorest half?
times
Part 4 Try it Compare two countries with the same income
An aid agency compares hypothetical Country W and hypothetical Country X. Both have a GNI per capita of $6,000. In Country W, 12 of every 1,000 babies die before age one, and 95% of adults can read and write. In Country X, 50 of every 1,000 babies die before age one, and 60% of adults can read and write. The agency's notes on Country X are below.
Try it · Match
Match each measure of development to the note about Country X that shows it.
Try it · Decide and justify
Using the agency's data on infant mortality and literacy, which country would you expect to rank higher on the Human Development Index?
Which reason supports your answer?
Part 5 Explain it Explain two countries' development
Nothing you type leaves this page. Check your answer against the model and each scoring point.
Free response is 50% of the exam score. This one is shaped like Question 2, from free-response II.
Free-response practice · Question 2 style
The data below describe two hypothetical countries.
Country F: GNI per capita $12,000; infant mortality 35 deaths per 1,000 live births; adult literacy 70%; share of workers in the informal economy 55%; women's share of all paid workers 25%.
Country G: GNI per capita $9,000; infant mortality 10 deaths per 1,000 live births; adult literacy 96%; share of workers in the informal economy 20%; women's share of all paid workers 45%.
(A) Identify the country with the higher GNI per capita.
(B) Describe what GNI per capita measures.
(C) Using one social measure from the data, describe a difference in development between the two countries.
(D) Explain why the Human Development Index could rank Country G above Country F, even though Country F has the higher GNI per capita.
(E) Explain how the data on women's share of paid workers relate to the Gender Inequality Index.
(F) Explain why Country F's large informal economy limits what its GNI per capita shows about development.
(G) Explain one limitation of using national data, such as these, to describe development across Country F.
Model answer
(A) Country F, at $12,000 per person against Country G's $9,000.
(B) GNI per capita is a country's gross national income, the income its people and companies earn at home and abroad in a year, divided by its population. It is the average income per person.
(C) Infant mortality: in Country F, 35 of every 1,000 babies die before age one, against 10 in Country G. Babies are far more likely to survive in Country G, which points to better health care and a higher level of development there.
(D) The HDI is a composite measure that combines health and education with income. Country F leads on income, but Country G is well ahead on infant mortality and literacy, which point the same way as the HDI's own health and education measures, so G's two leads can outweigh F's lead in income.
(E) The GII measures gaps between women and men. Women are only 25% of Country F's paid workers, against 45% in Country G, a sign of low labor-market participation by women in Country F, one of the GII's parts. That wider gap points to a higher, worse GII for Country F.
(F) Much informal income is missed by GNI or only roughly estimated. More than half of Country F's workers are in the informal economy, so much of what they earn may be missing from the figure, and the figure says nothing about their lack of contracts, pensions and legal protection.
(G) A national figure is an average for the whole country. It hides differences between regions, such as a wealthy capital and poor rural areas, and between rich and poor people, since an uneven income distribution can leave most people well below the average.
Score your own answer. This is a self-check, not a grade. Tick each point your answer makes.
Part 6 Check yourself Four countries in one region
The case questions use the table. The others mix the ideas from the whole lesson.
A regional development bank compares four hypothetical countries before it decides where to fund new clinics and schools.
| Country | GNI (billions of dollars) | Population (millions) | Total fertility rate | Infant mortality (per 1,000 live births) | Adult literacy |
|---|---|---|---|---|---|
| P | 90 | 30 | 4.5 | 45 | 65% |
| Q | 60 | 4 | 1.7 | 6 | 99% |
| R | 120 | 15 | 2.4 | 18 | 90% |
| S | 20 | 2 | 3.0 | 30 | 80% |
Case question 1 · Multiple choice
Which statement describes a pattern in the table?
Case question 2 · Rank it
Rank the four countries by GNI per capita. Work out each country's GNI per capita before you rank.
Highest GNI per capita first
Give each one a place, 1 for first. Give two the same place if they are equal.
Your ranking: none yet
Case question 3 · Multiple choice
Compare Country S with Country R. Here "ahead" means the measure points to a higher level of development. Which statement does the table support?
The rest stand on their own and do not use the case.
Check yourself · Spot the error
A student explains how foreign-owned factories affect hypothetical Country L's GDP, GNP and GNI. Which line is the first to go wrong?
Check yourself · Select all
Which two are measures the Gender Inequality Index draws on? Select two.
Select 2 answers, then check.
Part 7 Keep it Bring back earlier ideas
This lesson stands on the economic sectors from Topic 7.2 and the sustainability of cities from Topic 6.11.
Bring it back · Multiple choice
Which job in a hypothetical country belongs to the quinary sector?
Bring it back · Match
A hypothetical city is working on its sustainability. Match each response to the action that carries it out.
In three lines
- Economic measures: GDP counts production inside the borders, GNP and GNI count what a country's people and companies produce and earn, and GNI per capita divides by the population.
- An average hides a lot: check the sectoral structure, the informal economy and the income distribution, and read social measures such as fertility, infant mortality, health care, energy use and literacy beside it.
- Composite measures: the HDI combines health, education and income to compare countries, and the GII measures gaps between women and men, where a higher score is worse.
Exam strategy for this topic
- Section I, Multiple Choice: 60 questions in 60 minutes.
- Section II, Free Response: 3 questions in 75 minutes.
When a question gives a table of country data, divide any total by the population before you compare incomes, and say which way each social measure points: a higher literacy rate is better, a higher infant mortality rate is worse. When a question asks about the limits of a measure, name what it leaves out.
Questions students ask
Are GNP and GNI the same thing?
They are close. GNP adds up what a country's people and companies produce, at home and abroad, and GNI adds up the income they earn from it, so the two come out nearly the same. Both differ from GDP, which counts what is produced inside the borders whoever owns it.
Why divide by the population?
A total measures the size of an economy. A country with many people can have a large total and a low income per person, so per capita figures are the fair way to compare how well off people are.
Do I need to know how the HDI is calculated?
No. Know that it is a composite measure that combines health, education and income into one number, and that a map of it shows how development varies among countries.
Is a high GII good or bad?
Bad. The GII measures inequality between women and men, so a higher score means a wider gap. That is the opposite direction from the HDI, where higher means more developed.
Are the countries in this lesson real?
No. Every country here is hypothetical, with numbers chosen to show each measure clearly. The United Nations, which publishes the HDI and GII, is real.
Course alignment, for teachers
AP Human Geography topic 7.3, Unit 7: Industrial and Economic Development Patterns and Processes.
- Skill 3.F: Explain possible limitations of the data provided.
This lesson maps all 3 essential knowledge statements of the topic to the part that teaches each one: 3 are checked by a scored question. The map is in the lesson file.