Unit 1 · Topic 1.3 · about 30 minutes · 7 parts · 10 scored checks, 1 of them multiple choice, plus 2 from earlier lessons
AP Microeconomics 1.3: Production Possibilities Curve
Unit 1: 12 to 15% of the multiple-choice section
What you'll be able to do
- Describe what a production possibilities curve (PPC) models and name its parts, use it to show opportunity cost, trade-offs, efficient and wasted output, and economic growth or contraction, and compute opportunity cost from a PPC or a table.
Key vocabulary
| Term | What it means | The exam trap |
|---|---|---|
| Production possibilities curve (PPC) | A graph of the largest combinations of two goods an economy can make with all of its resources in full, efficient use and its current technology. | Each axis holds one of the two goods, so price, time and quantity never label a PPC's axes. |
| Scarcity | Resources too limited to produce everything people want. | Scarcity holds in rich economies as well as poor ones, so more money does not remove it. |
| Trade-off | Accepting less of one thing to get more of another. | Name both sides of a trade-off: the good gained and the good given up. |
| Factors of production | The resources goods and services are made from: land, labor and capital. | Money buys factors of production but is not one of them. |
| Productivity and technology | Productivity is how much output a unit of resources yields; technology is the know-how and methods behind it. | Keep the two words apart: productivity is measured output, technology is what people know how to do. |
| Efficiency | Producing on the PPC, with no resource idle or wasted. | Efficiency here describes how fully resources are used, not whether the mix of goods is the one people want most. |
| Underutilized resources | Resources that are unemployed or not put to their best use. | Read whether a question is about the curve itself or about where the economy is producing. |
| Opportunity cost | The value of the best alternative given up. Read off a PPC, it is how much of one good must go to get more of the other. | State the units of both goods with every cost you write, such as yearbooks per banner. |
| Constant, increasing and decreasing opportunity cost | Whether each added unit of a good takes the same amount, a bigger amount or a smaller amount of the other good than the unit before. | Shape words describe the curve as seen from the origin, so say bowed outward or bowed inward, not just curved. |
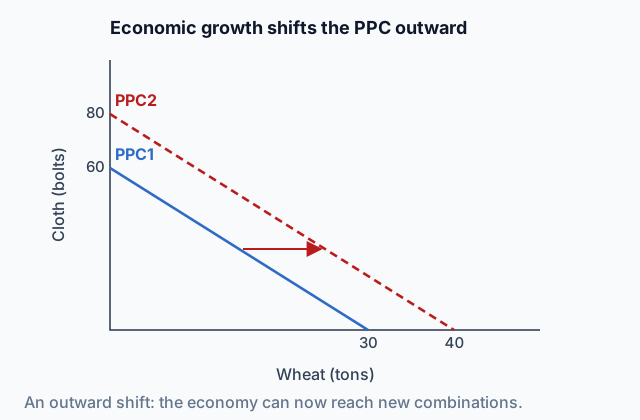
| Economic growth | A rise in an economy's capacity to produce, drawn as the PPC moving outward. | Read whether the question is about the curve moving or about the economy's point moving. |
| Economic contraction | A fall in an economy's capacity to produce, drawn as the PPC moving inward. | Draw contraction with the same conventions as growth: keep the old curve and label the new one. |
 Tap to open the picture full size
Part 1 Think first The park crew's summer
Make a guess first. Even a wrong guess helps the answer stick.
Predict first
A city park crew of 20 spends each summer planting trees and repairing benches. Last summer it planted 300 trees and repaired 40 benches, but the crew stood around two days a week waiting for late deliveries of soil and lumber. This summer the deliveries will arrive on time, and the crew and its tools are the same. Can the crew plant more trees and repair more benches this summer?
In short. A production possibilities curve (PPC) draws the limit scarcity sets: the largest amounts of two goods an economy can turn out together with the resources and technology it has, so sliding along it shows what each good costs in the other.
- On the curve nothing is wasted; inside it some resources sit idle or are misused; beyond it lies output the economy has no means to make yet.
- To price one more unit of a good, divide the change in the good given up by the change in the good gained; the curve's shape shows whether that price holds steady, climbs or falls.
- Gaining resources or getting more productive pushes the curve out, which is economic growth, and losing resources pulls it in.
Part 2 Learn it Four steps, each with a quick check
2a. Every combination on one graph
Suppose a country turns out just two goods, boats and bread. This year its land, workers and machines are fixed, and so is what it knows how to do. Plot every mix of boats and bread it could produce if no resource were wasted, and the line those points make is its production possibilities curve (PPC).
The PPC is a model of trade-offs. Any two points on it use the same resources split differently, so sliding along it always swaps some of one good for some of the other.
- On the curve: output is efficient. Nothing is idle or misused, and getting more of one good costs some of the other.
- Inside the curve: some resources are underutilized. People who want work cannot find it, machines stand still, or resources sit in jobs that suit them badly. More of both goods is possible.
- Outside the curve: the mix is unattainable for now. The country lacks the resources or the know-how to reach it, and that edge is scarcity drawn on a graph.
Quick check · Sort it
A country makes only boats and bread. Tap a situation, then tap the place on the graph where its output belongs.
On the PPC
Inside the PPC
Outside the PPC
2b. Pricing a move along the curve
Opportunity cost on a PPC is a price attached to a move from one point to another. Here are two points on a print shop's curve for one week, every press and worker busy.
| Point | Calendars | Posters |
|---|---|---|
| F | 200 | 500 |
| G | 250 | 400 |
Going from F to G adds 50 calendars and loses 100 posters (500 minus 400). One more calendar therefore costs 100 ÷ 50 = 2 posters.
Keep two rules. The amount lost sits on top of the fraction and the amount gained sits underneath. And the numbers in the fraction are differences between F and G. The 200 calendars and 500 posters at F only say where the shop started; dividing them prices nothing.
Quick check · Calculate
A school print shop, using every press and worker, can turn out 150 yearbooks and 20 banners in a month (point J) or 120 yearbooks and 30 banners (point K). Going from J to K, how many yearbooks does each extra banner cost?
2c. What the curve's shape says
Take the curve one step at a time and note what each step costs. The way that cost moves decides the shape.
- Constant opportunity cost: a straight line. The resources are just as good at one good as the other, so each extra unit costs the same. A sewing machine that makes either 6 shirts or 3 pairs of pants an hour gives up 2 shirts for every pair of pants, whatever the mix.
- Increasing opportunity cost: bowed outward, away from the origin. Resources are specialized. The first ones switched were poor at their old job, so they cost little; later ones were good at it, so each extra unit costs more. This is the usual case.
- Decreasing opportunity cost: bowed inward, toward the origin. Each extra unit costs less than the last, as when a producer gets quicker at a good the more of it it makes.
Judge the shape by how the size of each step's loss changes.
Quick check · Match
Tap a producer, then tap the shape of its PPC.
2d. Moving the curve itself
Every PPC assumes a set amount of resources and a set level of know-how. Alter either and the curve itself moves.
- Gaining factors of production (a bigger workforce, more machines, better-trained people) moves the curve out. Higher productivity or better technology, more output from the same inputs, does the same. That outward move is economic growth.
- Losing factors of production (to a flood, a war or emigration) moves the curve in: economic contraction.
- A gain that helps just one good pivots the curve outward along that good's axis. The other good's end stays put, because all resources in that good still make what they made before.
Some changes leave the curve alone. Rehiring idle workers moves the economy's point toward the curve, and a shift in what people want moves the point along it.
Quick check · Decide and justify
Kirin makes only smartphones and rice. A new chip design lets each factory worker assemble twice as many phones a day. Rice farming does not change, and neither do Kirin's resources. What happens to Kirin's PPC?
Which reason supports your choice?
Part 3 Watch it done A table with uneven steps
Follow each step, then finish the last one yourself.
Westfield grows apples and builds bicycles, nothing else. Each of these five combinations uses every resource it has, with none wasted:
- A: 0 bicycles and 120 tons of apples
- B: 5 bicycles and 117 tons of apples
- C: 15 bicycles and 105 tons of apples
- D: 30 bicycles and 75 tons of apples
- E: 40 bicycles and 35 tons of apples
Work out what one more bicycle costs in apples on each move from A toward E. Then run the last move backward.
Step 1 · A to B
5 more bicycles cost 3 tons of apples (120 minus 117), so each costs 3 ÷ 5 = 0.6 ton of apples. The steps here differ in width, so always divide by the bicycles this move actually adds.
Step 2 · B to C
10 more bicycles cost 12 tons (117 minus 105): 1.2 tons each.
Why this step?
Why does each bicycle cost more apples the further Westfield gets from A?
The first people and fields pulled out of the orchards were the ones that grew the least fruit. Each later move pulls in better orchard resources, so every bicycle they build means more apples lost. Specialized resources push the cost up, and that rising cost bends the curve outward.
Step 3 · C to D, then D to E
15 more bicycles cost 30 tons (105 minus 75): 2 tons each. Then 10 more cost 40 tons (75 minus 35): 4 tons each.
Your step · Calculate
Now the last move. Run it backward: Westfield goes from E (40 bicycles and 35 tons of apples) back to D (30 bicycles and 75 tons of apples), so this time it gains apples. What does each extra ton of apples cost, in bicycles?
bicycles
Part 4 Try it Draw the curve, then sketch one
Try it · Sketch the graph
Lonmar makes only wind turbines and rice. Its fields and workers each suit one kind of work, so each extra thousand turbines costs more rice than the thousand before. Sketch Lonmar's PPC: the most rice it can harvest at each turbine count from 0 to 4 thousand. The first point is fixed at 50 million tons, Lonmar's rice harvest when it builds no turbines.
One shape that fits
Drag a point up or down, or tap it and use the arrow keys. Only the shape is checked.
Part 5 Explain it Answer a short free-response question
Nothing you type leaves this page. Draw the graph on paper, then compare it with the model.
Free response is 33.35% of the exam score. This one is shaped like Question 2, Short.
Free-response practice · Question 2 style
Norvik grows wheat and makes solar panels, nothing else, and the more of either it makes, the more each extra unit costs in the other. (a) Draw a correctly labeled production possibilities curve for Norvik, label it PPC1, and plot a point X on PPC1. (b) On the same graph, plot a point Y that shows Norvik with unemployed workers. (c) Many of Norvik's workers emigrate. Show the effect on your graph and label the new curve PPC2. (d) Two points on PPC1 are 30 tons of wheat with 64 solar panels and 40 tons of wheat with 36 solar panels. Calculate the opportunity cost of each additional ton of wheat between these two points. Show your work.
Model answer
(a) Wheat on one axis and solar panels on the other, with PPC1 bowed away from the origin and X on it. (b) Y sits below and to the left of PPC1, inside it. (c) PPC2 lies inside PPC1 everywhere and meets both axes nearer the origin, with an arrow from PPC1 toward PPC2. (d) Going from 30 to 40 tons of wheat gains 10 tons and loses 64 − 36 = 28 solar panels, so each ton of wheat costs 28 ÷ 10 = 2.8 solar panels.
Norvik's PPC moves in
With fewer workers, PPC2 sits inside PPC1. X lies on PPC1 and Y inside it.
Score your own answer. This is a self-check, not a grade. Tick each point your answer makes.
Part 6 Check yourself Read a country's production table
Every answer below comes from this table.
Varela, a made-up country, produces only electric buses and wheat. Each row of the table is a mix it can reach in a year with every resource in use and none wasted:
| Point | Buses (hundreds) | Wheat (million bushels) |
|---|---|---|
| P | 0 | 48 |
| Q | 4 | 45 |
| R | 8 | 38 |
| S | 12 | 26 |
| T | 16 | 0 |
Case question 1 · Calculate
Going from point R to point S, how many million bushels of wheat does each additional hundred buses cost Varela?
Case question 2 · Multiple choice
This year Varela produces 8 hundred buses and 30 million bushels of wheat. Which statement about that combination is correct?
The rest stand on their own and do not use the case.
Check yourself · Spot the error
Pomara makes only buses and wheat. A new fertilizer doubles the wheat each farm grows, and nothing changes for buses. A student explained what happens to Pomara's PPC. Tap the first line with a mistake.
Check yourself · Fill the statement
Tap a blank, then tap a word.
A flood destroys a third of Ardena's farms and factories, so its PPC shifts , which is economic . Years later, a growing labor force shifts the curve , which is economic .
Part 7 Keep it Keep it
From 1.2 Resource Allocation and Economic Systems · Match
Tap each decision, then tap the basic question it answers.
From 1.1 Scarcity · Fill the statement
Tap a blank, then tap a word or phrase.
A school's chemistry teachers all use the same well-known method for balancing equations. When one teacher uses it, the others have of it, so the method is . The school's lab benches are different: a bench one class uses is not free for another, and more classes want lab time than the benches can hold, so the benches are .
In three lines
- Output on the PPC is efficient, under it some resources are wasted, and past it is out of reach for now.
- Price a move by dividing the change in the good lost by the change in the good won.
- A line means a fixed cost and a bow outward a climbing one; more resources or better technology move the curve out.
Exam strategy for this topic
- Section I, Multiple Choice: 60 questions in 70 minutes.
- Section II, Free Response: 3 questions in 60 minutes.
- This lesson's Explain it is shaped like free-response question 2, Short.
- A four-function calculator is allowed on both sections of the exam.
Name a good on each axis, label the first curve PPC1 and any new curve PPC2, and draw an arrow between them. For a cost, write how far each good moved before dividing, and answer per unit with units, such as 3 yearbooks per banner.
Questions students ask
Why does a PPC usually bow outward?
Resources are specialized. The ones moved first into a good are the ones worst at the other good, so they cost little; later moves pull in resources that are good at the other good, so each unit costs more.
When is a PPC a straight line?
When resources do equally well at both goods, so the next unit of one always costs the same amount of the other, wherever the economy starts.
Can an economy produce at a point inside its PPC?
Yes. A point inside is reachable; it just means some resources are idle or misused. Points beyond the curve are the ones today's resources and technology cannot reach.
Does a change in tastes move the PPC?
No. What people want changes which mix the economy picks, so its point slides along the curve. The curve itself moves only when resources, productivity or technology change.
How do I work out an opportunity cost from a table of points?
Choose the two points of the move, subtract to see how far each good moved, and divide the good lost by the good gained. Give the answer per unit, with units.
Course alignment, for teachers
AP Microeconomics topic 1.3, Unit 1: Basic Economic Concepts.
- Skill 4.A: Draw an accurately labeled graph or visual to represent an economic model or market.
This lesson maps all 5 essential knowledge statements of the topic to the part that teaches each one: 5 are checked by a scored question. The map is in the lesson file.