Unit 2 · Topic 2.1 · about 30 minutes · 7 parts · 11 scored checks, 2 of them multiple choice, plus 2 from earlier lessons
AP Microeconomics 2.1: Demand
Unit 2: 20 to 25% of the multiple-choice section
What you'll be able to do
- Define the terms behind consumer decisions and the law of demand, and explain with a graph how price and quantity demanded are related and how buyers respond to incentives and constraints.
- Explain with a graph how buyers respond when their incentives or constraints change, telling a shift of demand from a move along it.
Key vocabulary
| Term | What it means | The exam trap |
|---|---|---|
| Property rights | A clear, enforced claim to use something, keep what it earns and sell it. | They cover more than land and buildings: a song, an invention or a brand name can be owned too. |
| Incentive | A reward or penalty that changes what a choice pays. | Prices are the incentive this unit works with most, but not the only one. |
| Constraint | A limit on what a person is able to choose. | Constraints differ from person to person, so read whose choice the question is about. |
| Quantity demanded | How much of a good buyers will purchase at one specific price. | Read which price a question names; a quantity demanded belongs to that one price. |
| Demand | The whole schedule, or curve, of quantities buyers want at every possible price. | Demand is not a single number, so name a price before saying how much buyers want. |
| Law of demand | The rule that the quantity demanded moves in the opposite direction to the good's own price, all else equal. | It holds everything else equal, so when several things change at once, take them one at a time. |
| Marginal benefit | The most a buyer is willing to pay for one more unit of a good. | It is measured in dollars even though it stands for satisfaction. |
| Substitution effect | When a good's price rises, other goods become relatively cheaper, so buyers move some of their purchases to them. | It is one of three reasons for the slope, and a question may describe any of the three. |
| Income effect | When a good's price rises, a buyer's income can buy less, so the buyer buys less of the good. | Its name sounds like a change in income, but it starts from a change in price. |
| Diminishing marginal utility | Each extra unit of a good adds less satisfaction than the unit before it. | In 1.6 it explained choices between goods; here it explains the slope of one demand curve. |
| Market demand | The total quantity all buyers in a market want at each price. | A buyer who buys nothing at a high price still belongs to the market and counts at lower prices. |
| Normal and inferior goods | A normal good is one buyers want more of as their income rises; an inferior good is one they want less of as income rises. | Whether a good is normal or inferior depends on the buyer, so read which one the question says. |
| Substitutes and complements | Substitutes are goods used in place of each other; complements are goods used together. | Decide which relationship the goods have before deciding which way the curve moves. |
| Determinants of demand | The things other than a good's own price that change how much buyers want at every price. | The list is short, so learn it instead of guessing whether a change counts. |
 Tap to open the picture full size
Part 1 Think first A field anyone can harvest
Make a guess first. Even a wrong guess helps the answer stick.
Predict first
On a remote island, the law lets any passerby take whatever grows in any field. Kalani farms there and is deciding how much of her land to plant with sweet potatoes this season. What is she most likely to do?
In short. Demand is the whole schedule of quantities buyers want at each possible price, and the law of demand says that when a good's own price rises, the quantity demanded falls.
- A change in the good's own price is a movement along the demand curve; a change in anything else that matters to buyers shifts the whole curve.
- Demand slopes down because of the substitution effect, the income effect and diminishing marginal utility.
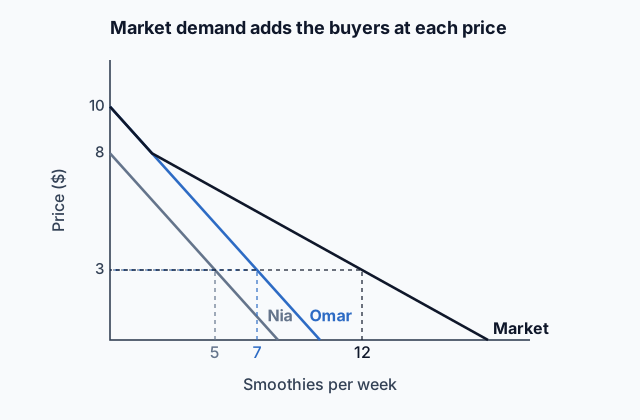
- Market demand is the sum of every buyer's quantity at each price.
Part 2 Learn it Four ideas, with a check after each
2a. Incentives, constraints and property rights
Markets depend on rules about who owns what. A property right is a clear, enforced claim to use a thing, keep what it earns and sell it. Without one, a seller cannot promise to deliver, and a producer has no reason to make anything, as Kalani's empty field showed. A market system works well only when property rights are well defined.
Within those rules, people respond to incentives: rewards and penalties that change what a choice pays. A lower price, a sale, a bonus for an extra shift and a fine for a late library book all change what people do.
People also face constraints, limits on what they can choose at all:
- Income: a budget caps total spending.
- Time: every week has the same 168 hours.
- Laws and regulations: some purchases are banned, limited by age or need a license.
A buyer's choice is a response to the incentives in front of them, made inside their constraints. Prices are the incentive this unit studies most.
Quick check · Sort it
Tap a situation, then tap whether it is an incentive or a constraint for the buyer.
Incentive
Constraint
2b. The law of demand
The law of demand: when a good's own price rises, the quantity buyers want falls, and when the price falls, the quantity rises, with everything else held the same. The amount buyers want at one particular price is the quantity demanded.
On a graph with price on the vertical axis and quantity on the horizontal, the law draws a downward-sloping demand curve. A change in the good's own price is a movement along that curve, never a shift of it. Each point on the curve also shows the most buyers will pay for that unit, its marginal benefit, so the demand curve is a marginal benefit curve too.
Why does it slope down? Three explanations, which work together:
- Substitution effect: a higher price makes other goods relatively cheaper, so buyers move some purchases to them.
- Income effect: a higher price means the same income buys less, so buyers can afford less of the good.
- Diminishing marginal utility: each extra unit adds less satisfaction than the one before, so buyers take more units only at a lower price.
Quick check · Multiple choice
The price of a ticket at Dalton's only cinema rises from $10 to $14, and no other price changes. Jae now sees two movies a month instead of four, and explains: "I like movies as much as ever, and there is nothing else I would rather do on those nights. At $14 a ticket, my pay just doesn't go as far." Which explanation of downward-sloping demand does Jae's reason show?
2c. Adding buyers: market demand
A market demand curve comes from adding up every buyer's demand. At each price, add the quantities all the buyers want. The price stays fixed while the quantities pile up, so on a graph the individual curves are added sideways.
Three regulars buy bagels at a cafe each week:
| Price | Ana | Ben | Cy | Market |
|---|---|---|---|---|
| $3 | 4 | 2 | 0 | 6 |
| $2 | 5 | 3 | 1 | 9 |
| $1 | 6 | 4 | 3 | 13 |
Cy buys nothing at $3, so at that price the market is Ana and Ben alone. Each buyer follows the law of demand, so the market quantity rises as the price falls as well.
More buyers means more quantity at every price. That is why the number of buyers is one of the things that move a market demand curve, the next idea.
Quick check · Calculate
Three friends buy iced tea at a school store. At $2 a bottle, Dee buys 3 a week, Eli buys 1 and Fay buys 4. At $1 a bottle, Dee buys 5, Eli buys 3 and Fay buys 6. What is the market quantity of iced tea demanded by these three buyers at $1 a bottle?
2d. What shifts demand
A change in demand means the whole curve moves: at every price, buyers want more (an increase, a shift right) or less (a decrease, a shift left). Only something other than the good's own price can do that. These are the determinants of demand:
- Tastes and preferences: a fad, an advertising campaign, a health report.
- Income: for a normal good, more income raises demand; for an inferior good, such as a store's generic brand for many shoppers, more income lowers it.
- Prices of related goods: a substitute is used instead of the good, so a rise in its price raises demand for the good. A complement is used with the good, so a rise in its price lowers demand for the good.
- Expectations: buyers who expect a higher price or a raise soon buy more now.
- Number of buyers: more buyers, more market demand.
Save the words "decrease in demand" for a shift left. When a higher own price cuts the amount bought, that is a fall in quantity demanded, a movement along the curve.
Quick check · Decide and justify
The price of tennis rackets rises sharply, and nothing else changes. What happens in the market for tennis balls?
Which reason supports your choice?
Part 3 Watch it done Building a town's demand for movie tickets
Follow each step, then finish the last one yourself.
Ridgeway's cinema sells to two groups of buyers. At $12 a ticket, students buy 200 tickets a month and adults buy 150. At $10, students buy 350 and adults 200. At $8, students buy 500 and adults 250. Build the market demand schedule, then see what new buyers do to it.
Step 1 · Add at each price
At $12: 200 + 150 = 350 tickets. At $10: 350 + 200 = 550. At $8: 500 + 250 = 750.
Step 2 · Check the shape
The market quantity rises as the price falls, 350 to 550 to 750, so plotted with price on the vertical axis the market demand curve slopes down, just as each group's does.
Why this step?
Why add the quantities at one price, and never the prices?
Every buyer in the market faces the same ticket price. Market demand asks how many tickets all buyers together want at that price, so the quantities add while the price stays fixed. Adding $12 and $12 would describe a price no one charges.
Your step · Calculate
A college opens in Ridgeway, and its students form a third group of buyers, separate from the town's students and adults. This third group buys 100 tickets a month at $12, 180 at $10 and 260 at $8, and the first two groups buy what they did before. What is the new market quantity demanded at $10?
tickets a month
Part 4 Try it Draw demand yourself
Try it · Sketch the graph
At a minor-league ballpark, fans buy 100 cups of lemonade a game at $6 a cup, 200 cups at $5, 300 at $4, 400 at $3 and 500 at $2. Sketch the demand curve for lemonade: the price that goes with each quantity from 100 to 500 cups. The first point is fixed at $6 for 100 cups.
One shape that fits
Drag a point up or down, or tap it and use the arrow keys. Only the shape is checked.
Part 5 Explain it Answer a short free-response question
Nothing you type leaves this page. Draw the graph on paper, then compare it with the model.
Free response is 33.35% of the exam score. This one is shaped like Question 2, Short.
Free-response practice · Question 2 style
Many readers choose between e-books and printed books. (a) Draw a correctly labeled graph of the demand for e-books. Label the curve D1. (b) The price of printed books falls. On your graph from part (a), show the effect on the demand for e-books. Label the new curve D2. (c) Explain why the demand curve moves the way you showed in part (b). (d) Suppose instead that the price of e-books falls. Does the demand curve for e-books shift? Explain.
Model answer
(a) Price on the vertical axis, quantity of e-books on the horizontal axis, and a downward-sloping curve labeled D1. (b) D2 is drawn to the left of D1. (c) Printed books are a substitute for e-books. When printed books get cheaper, some readers buy them instead, so fewer e-books are wanted at every price of e-books. (d) No. A fall in the e-book's own price moves buyers along D1 to a larger quantity demanded; the curve itself does not move.
A decrease in the demand for e-books
Cheaper printed books pull readers away, so D2 lies to the left of D1.
Score your own answer. This is a self-check, not a grade. Tick each point your answer makes.
Part 6 Check yourself Read one town's demand for milk
The case questions can all be answered from this table.
Three households in one small town buy all of its milk. The table gives the gallons each household buys in a week at four prices, with everything else held the same.
| Price per gallon | Ruiz | Chen | Okafor |
|---|---|---|---|
| $5 | 1 | 2 | 0 |
| $4 | 2 | 2 | 1 |
| $3 | 3 | 3 | 2 |
| $2 | 4 | 4 | 2 |
Case question 1 · Calculate
What is the market quantity of milk demanded by the three households at $3 a gallon?
Case question 2 · Multiple choice
The Chen household's income falls, and milk is a normal good for the Chens. The other two households are not affected. What happens in this town's market for milk?
Case question 3 · Fill the statement
Tap a blank, then tap a word or phrase.
When the price of milk falls from $4 to $3, the quantity the three households demand rises from gallons to gallons, which is the market demand curve. The height of a demand curve at any quantity shows buyers' of that unit.
The rest stand on their own and do not use the case.
Check yourself · Match
Tap each idea, then tap the situation that shows it.
Check yourself · Spot the error
Rocco's Pizza sells slices, and most customers order wings with them. A student explained what happens after one change. Tap the first line with a mistake.
Part 7 Keep it Keep it
From 1.6 Marginal Analysis and Consumer Choice · Calculate
Leo's total utility from slices of pizza at lunch is 20 utils for 1 slice, 36 utils for 2 slices, 48 utils for 3 slices and 56 utils for 4 slices. What is the marginal utility of the third slice, in utils?
From 1.4 Comparative Advantage and Trade · Decide and justify
One hat costs Mara 4 scarves to knit, and it costs Jon 6 scarves. Mara specializes in hats and offers to sell Jon each hat for 5 scarves. Would this trade benefit both of them?
Which reason supports your choice?
In three lines
- Markets need well-defined property rights, and buyers respond to incentives such as prices within limits of income, time and law.
- A change in a good's own price moves buyers along the demand curve; a determinant shifts the whole curve.
- Market demand adds every buyer's quantity at each price.
Exam strategy for this topic
- Section I, Multiple Choice: 60 questions in 70 minutes.
- Section II, Free Response: 3 questions in 60 minutes.
- This lesson's Explain it is shaped like free-response question 2, Short.
- A four-function calculator is allowed on both sections of the exam.
When a question names a change, say first whether it is the good's own price (a move along the curve) or a determinant (a shift), and name the determinant. On a graph, label the old and new curves D1 and D2 and show the direction with an arrow.
Questions students ask
What is the difference between a change in demand and a change in quantity demanded?
A change in quantity demanded is a move along one demand curve, caused only by a change in the good's own price. A change in demand is the whole curve moving, caused by a determinant such as income, tastes or the price of a related good.
Why does a demand curve slope downward?
Three reasons that work together: at a higher price buyers switch to relatively cheaper goods (the substitution effect), their income buys less (the income effect), and extra units add less satisfaction (diminishing marginal utility), so they buy more only at lower prices.
How do I build a market demand curve from individual ones?
Pick a price, add the quantities every buyer wants at that price, and repeat for each price. On a graph that adds the curves horizontally.
What does a demand curve have to do with marginal benefit?
Each point on the curve shows the most buyers will pay for that unit, which is the value they place on it. That is why the demand curve is also called the marginal benefit curve.
Why do property rights come up in a lesson on demand?
A market is people trading things they own. If ownership is unclear or unenforced, producers have little reason to make goods and buyers cannot count on getting what they pay for, so markets work poorly.
Course alignment, for teachers
AP Microeconomics topic 2.1, Unit 2: Supply and Demand.
- Skill 4.A: Draw an accurately labeled graph or visual to represent an economic model or market.
This lesson maps all 7 essential knowledge statements of the topic to the part that teaches each one: 7 are checked by a scored question. The map is in the lesson file.