Unit 2 · Topic 2.2 · about 30 minutes · 7 parts · 10 scored checks, 1 of them multiple choice, plus 2 from earlier lessons
AP Microeconomics 2.2: Supply
Unit 2: 20 to 25% of the multiple-choice section
What you'll be able to do
- Define the law of supply, and explain with a graph how the price of a good and the quantity sellers offer are related.
- Explain with a graph how sellers respond to changes in incentives and technology, telling a shift of supply from a move along it.
Key vocabulary
| Term | What it means | The exam trap |
|---|---|---|
| Quantity supplied | How much of a good sellers will offer for sale at one specific price. | It is one point on a supply curve, tied to one price. |
| Supply | The whole schedule, or curve, of quantities sellers offer at every possible price. | A supply curve is drawn for one group of sellers in one period, such as a day or a week. |
| Law of supply | The rule that the quantity supplied moves in the same direction as the good's own price, all else equal. | It holds everything else equal, so when several things change at once, take them one at a time. |
| Market supply | The total quantity all sellers in a market offer at each price. | It belongs to one market, so sellers in another town or another period are not part of it. |
| Determinants of supply | The things other than a good's own price that change how much sellers offer at every price. | Taxes and subsidies are on the list too; 2.8 covers them. |
| Input | Anything a firm uses to produce its good, such as labor, materials, energy or equipment. | An input for one firm can be the finished product of another. |
 Tap to open the picture full size
Part 1 Think first The price of flour doubles
Make a guess first. Even a wrong guess helps the answer stick.
Predict first
Corner Loaf bakes bread to sell at $5 a loaf. One month, the price it pays for flour doubles, and the price of bread in town stays at $5. How many loaves will Corner Loaf want to bake each day at $5?
In short. Supply is the whole schedule of quantities sellers offer at each possible price, and the law of supply says that when a good's own price rises, the quantity supplied rises too.
- A change in the good's own price is a movement along the supply curve; a change in anything else that matters to sellers shifts the whole curve.
- Market supply is the sum of every seller's quantity at each price, and it slopes upward.
- Input prices, technology, the number of sellers, expectations and the prices of other goods a seller could make all shift supply.
Part 2 Learn it Three ideas, with a check after each
2a. The law of supply
The law of supply: when a good's own price rises, sellers offer more of it, and when the price falls, they offer less, with everything else held the same. The amount sellers offer at one particular price is the quantity supplied.
Why more at a higher price? Making extra units usually costs more for each one: overtime pay, land less suited to the crop, older machines brought back into use. A unit gets made only if the price covers what it costs to make. A higher price covers the cost of units that were not worth making before, so out they come. A higher price also makes this good pay better than the other things the seller could produce.
On a graph with price on the vertical axis, the law draws an upward-sloping supply curve. A change in the good's own price is a movement along that curve, never a shift of it.
Quick check · Decide and justify
Strawberry growers in one valley are paid $4 a pint this week, up from $3 last week, and nothing else about the market has changed. What happens in the market for these growers' strawberries?
Which reason supports your choice?
2b. Adding sellers: market supply
A market supply curve comes from adding up every seller's supply. At each price, add the quantities all the sellers offer. As with demand, the price stays fixed and the quantities add, so on a graph the individual supply curves are added sideways.
Three orchards sell apples at a farmers market each Saturday:
| Price per bushel | Pine Hill | Red Gate | Long Acre | Market |
|---|---|---|---|---|
| $20 | 5 | 3 | 0 | 8 |
| $30 | 8 | 5 | 4 | 17 |
| $40 | 10 | 7 | 6 | 23 |
Long Acre's costs are higher, so at $20 it does not bring apples at all. Every orchard offers more as the price rises, and so does the market: the market supply curve slopes upward.
More sellers means more quantity at every price, so the number of sellers is one of the things that move market supply.
Quick check · Calculate
Two kettle corn stands sell at a county fair. At $3 a bag, Stand A offers 80 bags a day and Stand B offers 50. At $4 a bag, Stand A offers 120 and Stand B offers 90. What is the market quantity supplied by the two stands at $4 a bag?
2c. What shifts supply
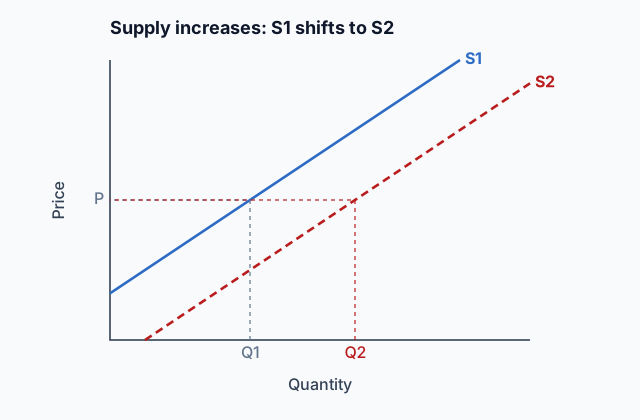
A change in supply means the whole curve moves: at every price, sellers offer more (an increase, a shift right) or less (a decrease, a shift left). Only something other than the good's own price does that. These are the determinants of supply:
- Input prices: wages, materials, rent and energy. Dearer inputs make every unit cost more, so supply falls.
- Technology: a better method or machine makes each unit cheaper to produce, so supply rises.
- Number of sellers: more sellers, more market supply.
- Prices of other goods the seller could make: if another product that uses the same land, workers or machines starts paying better, resources move to it and supply of this good falls.
- Natural events: a frost, drought or flood destroys output, so supply falls.
- Expectations: sellers who expect a higher price soon may hold some output back to sell later.
- Taxes and subsidies, which 2.8 takes up.
A decrease in supply is a shift to the left. Drawn on the graph it also sits higher, because each quantity now needs a higher price to cover its cost.
Quick check · Sort it
In the market for tomatoes, tap each change, then tap what it does to supply.
Supply shifts right
Supply shifts left
Move along supply
Part 3 Watch it done Two dairies supply a city's yogurt
Follow each step, then finish the last one yourself.
Two dairies supply all of a city's yogurt. At $2 a cup, Hillside offers 300 cups a day and Brookfield offers 200. At $3, Hillside offers 450 and Brookfield 350. At $4, Hillside offers 600 and Brookfield 500. Build the market supply schedule, then see what a new machine at one dairy does to it.
Step 1 · Add at each price
At $2: 300 + 200 = 500 cups. At $3: 450 + 350 = 800. At $4: 600 + 500 = 1,100.
Step 2 · Check the shape
The market quantity rises with the price, 500 to 800 to 1,100, so plotted with price on the vertical axis market supply slopes upward, as each dairy's does.
Why this step?
Why does it take a higher price to get more yogurt?
Each extra batch costs the dairies more than the one before: more overtime, more milk bought at short notice. A dairy fills an extra cup only if the price covers that cup's cost, so more cups come only at a higher price.
Your step · Calculate
Brookfield installs a faster filling line, and it now offers 100 more cups a day at every price. Hillside changes nothing. What is the new market quantity supplied at $3?
cups a day
Part 4 Try it Draw supply yourself
Try it · Sketch the graph
A pumpkin farm offers 100 pumpkins a week at $2 each, 200 at $3, 300 at $4, 400 at $5 and 500 at $6. Sketch the farm's supply curve: the price that goes with each quantity from 100 to 500 pumpkins. The first point is fixed at $2 for 100 pumpkins.
One shape that fits
Drag a point up or down, or tap it and use the arrow keys. Only the shape is checked.
Part 5 Explain it Answer a short free-response question
Nothing you type leaves this page. Draw the graph on paper, then compare it with the model.
Free response is 33.35% of the exam score. This one is shaped like Question 3, Short.
Free-response practice · Question 3 style
Small workshops build wooden chairs. (a) Draw a correctly labeled graph of the market supply of wooden chairs. Label the curve S1. (b) The price of lumber, which the workshops use to build chairs, rises. On your graph from part (a), show the effect on the supply of chairs. Label the new curve S2. (c) Explain why the supply curve moves the way you showed in part (b). (d) Before the change in lumber prices, there were 5 workshops, and each offered 40 chairs a week at $60 a chair. Calculate the market quantity of chairs supplied at $60. Show your work.
Model answer
(a) Price on the vertical axis, quantity of chairs on the horizontal axis, and an upward-sloping curve labeled S1. (b) S2 is drawn to the left of S1. (c) Lumber is an input. When it costs more, every chair costs more to build, so the workshops offer fewer chairs at each price. (d) Market supply adds every seller's quantity at the same price: 5 × 40 = 200 chairs a week.
A decrease in the supply of chairs
Dearer lumber raises the cost of every chair, so S2 lies to the left of S1.
Score your own answer. This is a self-check, not a grade. Tick each point your answer makes.
Part 6 Check yourself Read one town's supply of bike tune-ups
The case questions can all be answered from this table.
Three shops do all the bike tune-ups in one town. The table gives the tune-ups each shop offers in a week at four prices, with everything else held the same.
| Price per tune-up | Quick Spoke | Gearhouse | Pedal Doctor |
|---|---|---|---|
| $30 | 4 | 0 | 2 |
| $40 | 6 | 3 | 4 |
| $50 | 8 | 5 | 5 |
| $60 | 10 | 7 | 6 |
Case question 1 · Calculate
What is the market quantity of tune-ups supplied by the three shops at $50?
Case question 2 · Multiple choice
Gearhouse buys a repair stand that cuts the time each tune-up takes, and the other two shops change nothing. What happens to the town's supply of tune-ups?
Case question 3 · Fill the statement
Tap a blank, then tap a word or phrase.
When the price of a tune-up rises from $40 to $60, the market quantity supplied rises from to tune-ups a week, which is the market supply curve.
The rest stand on their own and do not use the case.
Check yourself · Match
In the market for sneakers, tap each determinant of supply, then tap the change that shows it.
Check yourself · Spot the error
A student explained what happens in the market for car washes after one change. Tap the first line with a mistake.
Part 7 Keep it Keep it
From 2.1 Demand · Multiple choice
The price of a ticket at Dalton's only cinema rises from $10 to $14, and no other price changes. Jae now sees two movies a month instead of four, and explains: "I like movies as much as ever, and there is nothing else I would rather do on those nights. At $14 a ticket, my pay just doesn't go as far." Which explanation of downward-sloping demand does Jae's reason show?
From 1.1 Scarcity · Decide and justify
A state park's most popular hiking trail is free to use. On summer weekends about 3,000 hikers a day want to start on it, but its parking lot and trailhead can handle about 800. Is the trail scarce on summer weekends?
Which reason supports your choice?
In three lines
- A rise in a good's own price brings out more of it, a movement along an upward-sloping supply curve.
- Market supply adds every seller's quantity at each price.
- Input prices, technology, the number of sellers, expectations and other goods' prices shift the whole curve.
Exam strategy for this topic
- Section I, Multiple Choice: 60 questions in 70 minutes.
- Section II, Free Response: 3 questions in 60 minutes.
- This lesson's Explain it is shaped like free-response question 3, Short.
- A four-function calculator is allowed on both sections of the exam.
Name the determinant before you draw: input price, technology, number of sellers, other goods' prices or expectations. Label the curves S1 and S2, put an arrow between them, and say what happens to the quantity offered at a given price.
Questions students ask
Why does a supply curve slope upward?
Producing extra units usually costs more for each additional one, so sellers offer more only when the price covers those higher costs. A higher price also draws resources away from other goods the seller could make.
What is the difference between a change in supply and a change in quantity supplied?
A change in quantity supplied is a move along one supply curve, caused only by the good's own price. A change in supply is the whole curve moving, caused by a determinant such as input prices or technology.
Why does a decrease in supply look like the curve moving up?
A leftward shift and an upward shift of an upward-sloping curve are the same move. Either way, sellers offer less at each price, or need a higher price for each quantity.
How do I build market supply from individual sellers?
Pick a price, add the quantities every seller offers at that price, and repeat for each price. A seller who offers nothing at a low price adds zero there.
Course alignment, for teachers
AP Microeconomics topic 2.2, Unit 2: Supply and Demand.
- Skill 4.A: Draw an accurately labeled graph or visual to represent an economic model or market.
This lesson maps all 3 essential knowledge statements of the topic to the part that teaches each one: 3 are checked by a scored question. The map is in the lesson file.