Unit 2 · Topic 2.3 · about 30 minutes · 7 parts · 11 scored checks, 2 of them multiple choice, plus 2 from earlier lessons
AP Microeconomics 2.3: Price Elasticity of Demand
Unit 2: 20 to 25% of the multiple-choice section
What you'll be able to do
- Define price elasticity of demand, calculate it from a table or graph, and explain with a graph what makes demand elastic, inelastic or unit elastic and how a price change then moves total revenue.
Key vocabulary
| Term | What it means | The exam trap |
|---|---|---|
| Elasticity | A measure of how strongly one quantity responds to a change in another, as a ratio of percentage changes. | Economists measure it for income and for the prices of other goods too, not only for a good's own price. |
| Price elasticity of demand | The percentage change in quantity demanded divided by the percentage change in the good's own price. | The raw value is negative because price and quantity move in opposite directions; quote its absolute value when you classify it. |
| Midpoint method | Finding a percentage change by dividing the change by the average of the starting and ending values. | The average is of the two values being compared, not of every value in a table. |
| Elastic and inelastic | Demand is elastic when the absolute value of its price elasticity is more than 1, inelastic when it is less than 1, and unit elastic when it equals 1. | These words describe how strongly buyers respond, not how much they buy. |
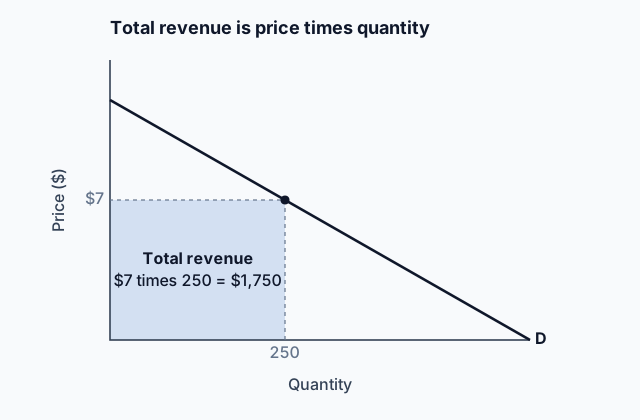
| Total revenue | Price times quantity sold: what sellers take in, and what buyers spend. | Sellers' total revenue and buyers' total spending are the same dollars seen from two sides. |
 Tap to open the picture full size
Part 1 Think first Two price rises of 10 percent
Make a guess first. Even a wrong guess helps the answer stick.
Predict first
On the same Monday, every gas station in a town raises its price by 10%, and one cereal maker raises the price of its own brand of corn flakes by 10% at the town's grocery store. A month later, which has lost the larger share of its sales?
In short. Price elasticity of demand measures how strongly the quantity demanded responds to a change in the good's own price: the percentage change in quantity demanded divided by the percentage change in price.
- In absolute value, more than 1 is elastic, less than 1 is inelastic, and exactly 1 is unit elastic.
- Goods with many close substitutes tend to have more elastic demand, and elasticity changes along a straight-line demand curve even though its slope does not.
- Whether a price rise raises or lowers total revenue depends on whether demand is inelastic or elastic.
Part 2 Learn it Four ideas, with a check after each
2a. Measuring responsiveness
An elasticity measures how much one thing responds to another, as a ratio of percentage changes. Economists measure how quantity responds to a good's own price, to buyers' incomes and to the prices of related goods. This lesson takes the first.
Price elasticity of demand = percentage change in quantity demanded ÷ percentage change in price.
Percentages need a base. The midpoint method divides each change by the average of the two values, so the answer is the same whether the price rises or falls. Price and quantity move in opposite directions, so the ratio is negative; quote its absolute value.
A sandwich shop raises its price from $8 to $10, and daily sales fall from 120 to 80.
- Quantity: change of −40, average 100, so −40%.
- Price: change of 2, average 9, so about 22.2%.
- Elasticity: 40 ÷ 22.2 ≈ 1.8.
Percentages make the measure unit-free: it reads the same in dollars or cents, sandwiches or dozens.
Quick check · Calculate
When a museum raises its ticket price from $10 to $14, attendance falls from 1,100 to 900 visitors a day. Using the midpoint method, what is the absolute value of the price elasticity of demand over this range? Give your answer to two decimal places.
2b. Elastic, inelastic, unit elastic
The dividing line is a magnitude of 1, where quantity changes by the same percentage as price.
- Elastic: more than 1. Quantity responds more than in proportion to price. The sandwich shop's 1.8 is elastic.
- Inelastic: less than 1. Quantity responds less than in proportion.
- Unit elastic: exactly 1. The two percentages are equal.
Each label describes demand over the price range measured, not the good forever.
Slope is not elasticity. On a straight-line demand curve, every $1 cut adds the same number of units, so the slope never changes. The percentages do. Near the top, the price is high and the quantity is small, so a $1 cut is a small percentage of the price while the added units are a large percentage of the quantity: demand is elastic there. Near the bottom, the reverse holds and demand is inelastic. Halfway down, it is unit elastic.
Quick check · Multiple choice
The demand curve for monthly bus passes in a city is a straight line. A cut in the price from $9 to $8 raises the quantity demanded from 100 to 200 passes, and a cut from $2 to $1 raises it from 800 to 900. Which statement is true?
2c. What makes demand elastic
The biggest single factor is the availability of substitutes. When buyers have close alternatives, a price rise sends them elsewhere, so demand is elastic. When they do not, they keep buying, so demand is inelastic.
That is also why the definition of the market matters. One brand of cereal has many close substitutes on the same shelf; cereal as a whole has fewer; food as a whole has almost none.
Other factors push the same way:
- Share of the budget: a price rise on something that takes a big bite of income, such as rent, gets more of a response than one on salt.
- Necessity or luxury: goods buyers see as essential, such as needed medicine, have less elastic demand.
- Time: buyers find more substitutes the longer they have to adjust, so demand is more elastic over a year than over a week.
Quick check · Rank it
Rank the demand for these three goods by price elasticity of demand.
Most elastic first
Give each one a place, 1 for first. Give two the same place if they are equal.
Your ranking: none yet
2d. Elasticity and total revenue
Total revenue is price × quantity, what sellers take in and what buyers spend. A price change pulls the two parts in opposite directions, and elasticity says which pull wins.
- Elastic demand: quantity changes by a larger percentage than price, so a price rise lowers total revenue and a price cut raises it.
- Inelastic demand: quantity changes by a smaller percentage, so a price rise raises total revenue and a price cut lowers it.
- Unit elastic demand: the two changes offset, so total revenue does not change.
The sandwich shop again: 120 sandwiches at $8 bring in $960, and 80 at $10 bring in $800. Demand was elastic, and the price rise cut revenue.
This works backward too. If a price rise raised revenue, demand was inelastic over that range.
Quick check · Decide and justify
Demand for tickets at a climbing gym is elastic at its current price. The owner wants to bring in more total revenue. Should the owner raise or lower the price?
Which reason supports your choice?
Part 3 Watch it done A food truck tests a higher price
Follow each step, then finish the last one yourself.
A food truck sells 200 burritos a day at $9 each. For a week it charges $11 and sells 150 a day. Is demand elastic or inelastic over this range, and what happened to the truck's revenue?
Step 1 · Percentage change in quantity
The change is 150 − 200 = −50 on an average of (200 + 150) ÷ 2 = 175, so −50 ÷ 175 ≈ −28.57%.
Step 2 · Percentage change in price, and elasticity
The change is $2 on an average of $10, so 2 ÷ 10 = 20%. Elasticity = 28.57 ÷ 20 ≈ 1.43, more than 1, so demand is elastic over this range.
Why this step?
Why divide by the average of the two values instead of the starting value?
With the starting value, going from $9 to $11 is about a 22.2% rise but going back from $11 to $9 is about an 18.2% fall, so the same stretch of the curve would get two different elasticities. The average gives one answer either way.
Step 3 · What elasticity predicts
Elastic demand means a price rise lowers total revenue: the lost sales outweigh the higher price on each burrito. Check it in dollars.
Your step · Calculate
By how many dollars a day did the truck's total revenue fall when it raised the price of a burrito from $9 to $11 and daily sales fell from 200 to 150?
dollars a day
Part 4 Try it New numbers, your turn
Try it · Select all
The price of each of these rises by 20%, and nothing else changes. For which two will buyers' total spending on the item rise? Select two.
Select 2 answers, then check.
Part 5 Explain it Answer a short free-response question
Nothing you type leaves this page. Draw the graph on paper, then compare it with the model.
Free response is 33.35% of the exam score. This one is shaped like Question 2, Short.
Free-response practice · Question 2 style
A city ferry charges $4 a ride and carries 5,000 riders a day. When it raises the fare to $6, ridership falls to 4,000 a day. (a) Calculate the price elasticity of demand for ferry rides over this range, using the midpoint method. Show your work. (b) Is demand for ferry rides elastic, inelastic or unit elastic over this range? Explain using your answer to part (a). (c) What happens to the ferry's total revenue when the fare rises? Explain using the elasticity. (d) Draw a correctly labeled graph of the demand for ferry rides, and label the point before the fare rise A and the point after it B.
Model answer
(a) Quantity changes by −1,000 on an average of 4,500, about −22.2%. Price changes by $2 on an average of $5, 40%. Elasticity = 22.2 ÷ 40 ≈ 0.56. (b) Inelastic, because 0.56 is less than 1: ridership falls by a smaller percentage than the fare rises. (c) Total revenue rises, from $4 × 5,000 = $20,000 to $6 × 4,000 = $24,000 a day, because with inelastic demand the higher fare outweighs the smaller fall in riders. (d) Price on the vertical axis, quantity of rides on the horizontal axis, a downward-sloping demand curve, with A at $4 and 5,000 and B at $6 and 4,000.
Demand for ferry rides
The fare rise moves riders up along the demand curve from A to B.
Score your own answer. This is a self-check, not a grade. Tick each point your answer makes.
Part 6 Check yourself Read a juice bar's sales
The case questions can all be answered from this table.
A juice bar tried three prices for its large smoothie in three different months, with nothing else changing. The table gives the price and the smoothies sold each week.
| Price | Smoothies sold |
|---|---|
| $4 | 600 |
| $5 | 500 |
| $6 | 300 |
Case question 1 · Calculate
Using the midpoint method, what is the absolute value of the price elasticity of demand for smoothies when the price rises from $5 to $6? Give your answer to two decimal places.
Case question 2 · Multiple choice
The juice bar is charging $5. Using the table, what should it do with its price if it wants the most total revenue from smoothies?
Case question 3 · Fill the statement
Tap a blank, then tap a word or phrase.
When the price rises from $4 to $5, demand for smoothies is , so the price rise total revenue.
The rest stand on their own and do not use the case.
Check yourself · Sort it
Each card describes a measured response. Tap a card, then tap how demand is described over that range, or tap the last bin if the card does not measure a response to the good's own price.
Elastic
Inelastic
Unit elastic
Not a price elasticity of demand
Check yourself · Spot the error
A student described the price elasticity of demand along one straight-line demand curve. Tap the first line with a mistake.
Part 7 Keep it Keep it
From 2.2 Supply · Decide and justify
Strawberry growers in one valley are paid $4 a pint this week, up from $3 last week, and nothing else about the market has changed. What happens in the market for these growers' strawberries?
Which reason supports your choice?
From 1.6 Marginal Analysis and Consumer Choice · Rank it
Bea has a little money left and is choosing her next purchase. A paperback costs $10 and would add 70 utils. A movie ticket costs $12 and would add 72 utils. A smoothie costs $2 and would add 18 utils. Rank the three by marginal utility per dollar.
Highest marginal utility per dollar first
Give each one a place, 1 for first. Give two the same place if they are equal.
Your ranking: none yet
In three lines
- Price elasticity of demand is the percentage change in quantity demanded divided by the percentage change in price, found by the midpoint method.
- Above 1 is elastic, below 1 inelastic, exactly 1 unit elastic; close substitutes make demand more elastic, and slope is not elasticity.
- A price rise lowers total revenue when demand is elastic and raises it when demand is inelastic.
Exam strategy for this topic
- Section I, Multiple Choice: 60 questions in 70 minutes.
- Section II, Free Response: 3 questions in 60 minutes.
- This lesson's Explain it is shaped like free-response question 2, Short.
- A four-function calculator is allowed on both sections of the exam.
Show both percentage changes with their averages before you divide, and label the result elastic, inelastic or unit elastic with the comparison to 1. For a revenue question, state the elasticity first, then say which way price × quantity moves.
Questions students ask
Why is price elasticity of demand usually reported as a positive number?
Price and quantity demanded move in opposite directions, so the ratio comes out negative. Economists classify it by its absolute value, so 1.8 and −1.8 both mean elastic.
Why use the midpoint method?
It divides each change by the average of the two values, so a move from $8 to $10 and a move from $10 to $8 give the same elasticity. Using the starting value would give two different answers for the same stretch of the curve.
Is a steep demand curve always inelastic?
No. Steepness is slope, which depends on the units on the axes. Along any straight-line demand curve, demand is elastic at high prices, unit elastic halfway down and inelastic at low prices.
How can I tell elasticity from total revenue alone?
If a price rise raises total revenue, demand was inelastic over that range; if it lowers revenue, demand was elastic; if revenue does not change, demand was unit elastic.
What makes demand for a good more elastic?
Close substitutes above all, along with a large share of the buyer's budget, being a luxury rather than a necessity, and more time to adjust.
Course alignment, for teachers
AP Microeconomics topic 2.3, Unit 2: Supply and Demand.
- Skill 3.C: Determine the effect(s) of a change in an economic situation using quantitative data or calculations.
This lesson maps all 5 essential knowledge statements of the topic to the part that teaches each one: 5 are checked by a scored question. The map is in the lesson file.