Unit 2 · Topic 2.5 · about 30 minutes · 7 parts · 10 scored checks, 1 of them multiple choice, plus 2 from earlier lessons
AP Microeconomics 2.5: Other Elasticities
Unit 2: 20 to 25% of the multiple-choice section
What you'll be able to do
- Define income and cross-price elasticity of demand, calculate each from data, and use its sign to explain whether a good is normal or inferior, or whether two goods are substitutes, complements or unrelated.
Key vocabulary
| Term | What it means | The exam trap |
|---|---|---|
| Income elasticity of demand | The percentage change in the quantity demanded of a good divided by the percentage change in buyers' incomes. | Income must change while prices stay put; a change in the good's own price belongs to a different elasticity. |
| Cross-price elasticity of demand | The percentage change in the quantity demanded of one good divided by the percentage change in the price of another good. | Two goods are involved, so name which good's quantity and which good's price before you divide. |
| Normal good | A good whose demand rises when buyers' incomes rise. | Normal says nothing about how common or popular a good is; it describes only the response to income. |
| Inferior good | A good whose demand falls when buyers' incomes rise. | Inferior is not a verdict on quality; a well-made good can be inferior for some buyers. |
| Substitutes | Goods that buyers use in place of one another. | They need not be alike; they only need to fill the same need for the buyer. |
| Complements | Goods that buyers use together. | A change in one good's price moves the demand for the other; it does not change the other good's own price. |
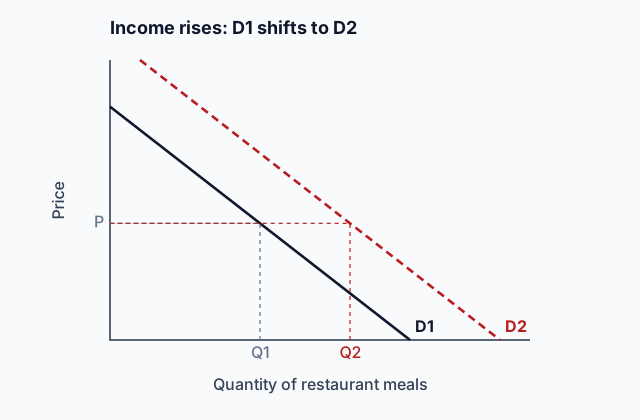 Tap to open the picture full size
Part 1 Think first One raise, two directions
Make a guess first. Even a wrong guess helps the answer stick.
Predict first
Lena gets a 10 percent raise, and no prices change. Over the next few months she buys fewer cans of store-brand soup and eats out more often. How can one raise push her buying in opposite directions?
In short. Income elasticity and cross-price elasticity of demand measure how strongly the quantity demanded of a good responds to a change in buyers' incomes or in the price of another good, and their signs say what kind of good it is.
- Any elasticity divides a percentage change in quantity by a percentage change in one of its determinants, not just the good's own price.
- Income elasticity above zero marks a normal good; below zero, an inferior good.
- Cross-price elasticity above zero marks substitutes, below zero complements, and zero goods that are not related.
Part 2 Learn it Three ideas, with a check after each
2a. An elasticity for any determinant
The price elasticities you have met divide a percentage change in quantity by a percentage change in the good's own price. Nothing limits the bottom of the fraction to that price. Demand also depends on buyers' incomes and on the prices of other goods, and supply depends on input prices and more, so an elasticity can be measured for any of them:
$$\text{elasticity} = \frac{\text{percentage change in quantity}}{\text{percentage change in the determinant}}$$
Two of these get names in this course.
- Income elasticity of demand: the bottom is the percentage change in buyers' incomes.
- Cross-price elasticity of demand: the bottom is the percentage change in the price of a different good.
The percentage changes are worked by the midpoint method, as before.
One habit changes. With price elasticity of demand you could drop the minus sign, because it is always negative. Here the sign can go either way, and the sign carries the answer, so keep it.
Quick check · Match
Each situation can be measured as an elasticity, with the percentage change in quantity on top. Tap a situation, then tap the change that goes on the bottom of its fraction.
2b. Income elasticity: normal or inferior
$$\text{income elasticity of demand} = \frac{\text{percentage change in quantity demanded}}{\text{percentage change in income}}$$
Prices stay fixed while income changes. Then read the sign.
- Positive: buyers want more as incomes rise. The good is a normal good: concert tickets, new furniture, dinners out.
- Negative: buyers want less as incomes rise, because they switch to things they prefer. The good is an inferior good: for many households, store-brand staples or long bus rides in place of a car.
Say average income in a town rises from $50,000 to $55,000 and gym memberships go from 2,000 to 2,300.
- Quantity: 300 ÷ 2,150 is about 14.0%.
- Income: 5,000 ÷ 52,500 is about 9.5%.
- Income elasticity: 14.0% ÷ 9.5% is about 1.47, positive, so gym memberships are a normal good there.
Whether a good is normal or inferior can differ from one group of buyers to another. The data decide, not the name of the good.
Quick check · Calculate
When a household's income rises from $40,000 to $60,000 a year, with prices unchanged, its restaurant meals rise from 10 to 14 a month. Using the midpoint method, what is its income elasticity of demand for restaurant meals? Round to two decimal places, and give a negative number if it is negative.
2c. Cross-price elasticity: substitutes or complements
$$\text{cross-price elasticity of demand} = \frac{\text{percentage change in quantity demanded of good A}}{\text{percentage change in the price of good B}}$$
Good A's own price stays fixed. Read the sign.
- Positive: B's price rises and buyers want more A. They use A in place of B, so the goods are substitutes, like two brands of sparkling water.
- Negative: B's price rises and buyers want less A. They use A together with B, so the goods are complements, like tennis rackets and tennis balls.
- Zero: B's price does not affect A at all. The goods are not related.
Say the price of streaming service B rises from $9 to $11 a month and subscriptions to streaming service A go from 4,000 to 4,800.
- Quantity of A: 800 ÷ 4,400 is about 18.2%.
- Price of B: 2 ÷ 10 = 20%.
- Cross-price elasticity: 18.2% ÷ 20% is about 0.91, positive, so the services are substitutes.
The benchmark of 1 from price elasticity plays no part here. A cross-price elasticity of 0.2 still marks substitutes.
Quick check · Decide and justify
The price of game consoles rises 20 percent. With the price of console games unchanged, the quantity of console games demanded falls 30 percent. How are console games and game consoles related?
Which reason supports your choice?
Part 3 Watch it done Instant noodles after a raise
Follow each step, then finish the last one yourself.
When a student's income rises from $30,000 to $36,000 a year, with prices unchanged, the packs of instant noodles the student buys fall from 50 to 40 a year. Find the income elasticity of demand by the midpoint method, and say whether noodles are a normal or an inferior good for this student.
Step 1 · Percentage change in quantity
The change is 40 − 50 = −10 packs. The average of 50 and 40 is 45, so the change is −10 ÷ 45, about −22.2%. The minus sign stays.
Step 2 · Percentage change in income
The change is $36,000 − $30,000 = $6,000. The average is $33,000, so the change is 6,000 ÷ 33,000, about 18.2%.
Why this step?
Why does the minus sign matter here when it could be dropped for price elasticity of demand?
Price elasticity of demand is always negative, so its sign tells you nothing new. Income elasticity can be either sign, and the sign is exactly what separates a normal good from an inferior one.
Your step · Calculate
Now finish it: divide the percentage change in noodles bought (about −22.2%) by the percentage change in income (about 18.2%). What is the student's income elasticity of demand for noodles? Round to two decimal places, and give a negative number if it is negative.
Part 4 Try it Read the sign, your turn
Try it · Sort it
Each card gives a change in one good's price and what happens to the quantity demanded of another good, whose own price does not change. Tap a card, then tap how the two goods are related.
Substitutes
Complements
Not related
Part 5 Explain it Answer a short free-response question
Nothing you type leaves this page. Draw the graph on paper, then compare it with the model.
Free response is 33.35% of the exam score. This one is shaped like Question 2, Short.
Free-response practice · Question 2 style
In the town of Dunmore, average household income rises from $50,000 to $70,000 a year while prices stay the same, and the quantity of Good X demanded falls from 200 to 160 units a week. (a) Calculate the income elasticity of demand for Good X, using the midpoint method. Show your work. (b) Is Good X a normal good or an inferior good in Dunmore? Explain. (c) The cross-price elasticity of demand for Good X with respect to the price of Good Y is −0.6. Are X and Y substitutes or complements? Explain. (d) Incomes now stay the same, but the price of Good Y rises. Draw a correctly labeled graph of the demand for Good X, and show the effect on it. Label the original curve D1 and the new curve D2.
Model answer
(a) Quantity: (160 − 200) ÷ 180 is about −22.2%. Income: (70,000 − 50,000) ÷ 60,000 is about 33.3%. Income elasticity = −22.2% ÷ 33.3%, about −0.67. (b) Inferior: the elasticity is negative, because the quantity demanded fell as income rose. (c) Complements: the cross-price elasticity is negative, so a rise in Y's price lowers the quantity of X demanded. (d) Price of X on the vertical axis and quantity of X on the horizontal axis, with the demand curve shifting left from D1 to D2.
Demand for Good X after Good Y's price rises
X and Y are complements, so a pricier Y lowers the demand for X: D1 shifts left to D2.
Score your own answer. This is a self-check, not a grade. Tick each point your answer makes.
Part 6 Check yourself Read a city's bus survey
The case questions can all be answered from this table.
The transit office in Larkton tracked how the number of bus rides changed after three separate events. Bus fares did not change during any of them, and the table gives each event's percentage changes.
| Event | Change in the quantity of bus rides demanded |
|---|---|
| Average income rises 10% | Falls 5% |
| The price of gasoline rises 20% | Rises 6% |
| The price of coffee at bus-stop cafes rises 25% | No change |
Case question 1 · Calculate
What is the income elasticity of demand for bus rides in Larkton? Give a negative number if it is negative.
Case question 2 · Multiple choice
What does the gasoline row show about gasoline and bus rides in Larkton?
Case question 3 · Fill the statement
Tap a blank, then tap a word or phrase.
In Larkton, bus rides are , and bus rides and bus-stop coffee are .
The rest stand on their own and do not use the case.
Check yourself · Spot the error
When the price of a movie ticket rises from $10 to $14, with streaming prices unchanged, the number of streaming subscriptions bought rises from 800 to 1,000 a month. A student worked out the cross-price elasticity. Tap the first line with a mistake.
Check yourself · Select all
Each result describes one good, with all prices unchanged. Which two show an inferior good? Select two.
Select 2 answers, then check.
Part 7 Keep it Keep it
From 2.4 Price Elasticity of Supply · Sort it
Tap a description of a seller's supply over one price range, then tap the label it earns.
Elastic
Inelastic
Unit elastic
From 2.2 Supply · Decide and justify
Strawberry growers in one valley are paid $4 a pint this week, up from $3 last week, and nothing else about the market has changed. What happens in the market for these growers' strawberries?
Which reason supports your choice?
In three lines
- An elasticity can be measured for any determinant: a percentage change in quantity over a percentage change in that determinant.
- Income elasticity of demand above zero means a normal good, below zero an inferior good.
- Cross-price elasticity of demand above zero means substitutes, below zero complements, and zero means not related.
Exam strategy for this topic
- Section I, Multiple Choice: 60 questions in 70 minutes.
- Section II, Free Response: 3 questions in 60 minutes.
- This lesson's Explain it is shaped like free-response question 2, Short.
- A four-function calculator is allowed on both sections of the exam.
Show both midpoint percentages, the division and the sign, then name what the sign means: normal or inferior for income, substitutes or complements for cross-price. A one-word answer without the sign, or without the reason, leaves the explanation out.
Questions students ask
Why keep the minus sign here when price elasticity of demand often drops it?
Price elasticity of demand is always negative, so its sign adds nothing. Income and cross-price elasticities can be either sign, and the sign is what tells you the kind of good.
Can a good be normal for one person and inferior for another?
Yes. Bus rides can be normal for a student who could never afford a car and inferior for a worker who buys one after a raise. Income elasticity is measured for a group of buyers over a range of incomes.
Does a cross-price elasticity of 0.2 mean the goods are barely substitutes?
It means they are substitutes, but weak ones: a rise in the other good's price moves buyers only a little. The sign decides the relationship and the size says how strong it is.
Can elasticity be measured for things that affect supply?
Yes. Any determinant can sit on the bottom of the fraction, such as the price of an input. This course names income and cross-price elasticity of demand, alongside the two price elasticities.
Course alignment, for teachers
AP Microeconomics topic 2.5, Unit 2: Supply and Demand.
- Skill 3.C: Determine the effect(s) of a change in an economic situation using quantitative data or calculations.
This lesson maps all 3 essential knowledge statements of the topic to the part that teaches each one: 3 are checked by a scored question. The map is in the lesson file.