Unit 2 · Topic 2.6 · about 30 minutes · 7 parts · 11 scored checks, 2 of them multiple choice, plus 2 from earlier lessons
AP Microeconomics 2.6: Market Equilibrium and Consumer and Producer Surplus
Unit 2: 20 to 25% of the multiple-choice section
What you'll be able to do
- Define market equilibrium, consumer surplus and producer surplus, explain how a competitive market sets the equilibrium price and quantity and why that outcome is efficient, and calculate consumer and producer surplus from a graph or table.
Key vocabulary
| Term | What it means | The exam trap |
|---|---|---|
| Market equilibrium | The price and quantity at which the quantity demanded equals the quantity supplied. | It is about quantities matching at one price, not about buyers and sellers being equally pleased. |
| Equilibrium price | The price at which buyers want to buy exactly the quantity sellers want to sell; also called the market-clearing price. | Read it on the price axis, level with where the curves cross, not from the quantity axis. |
| Consumer surplus | The difference between the most buyers are willing to pay and the price they actually pay, added up over every unit bought. | Only buyers who actually buy add to it; a buyer priced out of the market adds nothing. |
| Producer surplus | The difference between the price sellers receive and the lowest price they would accept, added up over every unit sold. | It is not the same as profit; it compares the price with each seller's lowest acceptable price. |
| Total economic surplus | Consumer surplus plus producer surplus: the whole gain from trade in a market. | It is measured within one market, for the units traded in it. |
| Efficient market | A market that produces the quantity that makes total economic surplus as large as possible. | Efficiency in this sense holds only when no costs or benefits spill onto people outside the market. |
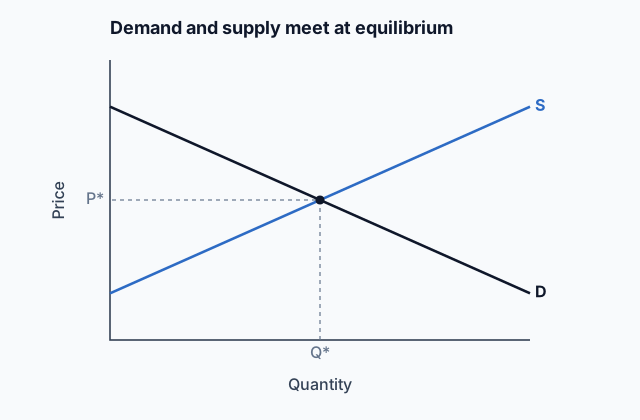 Tap to open the picture full size
Part 1 Think first Who plans the bread?
Make a guess first. Even a wrong guess helps the answer stick.
Predict first
Every morning, the people of a city of 50,000 buy close to the amount of bread its bakeries baked overnight, and nobody is in charge of matching the two. What keeps them so close?
In short. A competitive market is in equilibrium at the price where the quantity buyers want equals the quantity sellers offer, and consumer and producer surplus measure what buyers and sellers gain from trading there.
- At the equilibrium price the market clears: no shortage and no surplus.
- The price carries information, telling buyers how sparingly to use a good and sellers how much of it to make.
- Consumer surplus is the area below demand and above the price; producer surplus is the area above supply and below the price, and their total is largest at equilibrium.
Part 2 Learn it Four ideas, with a check after each
2a. Where the curves cross
Put a market's demand curve and supply curve on one graph, price up the side and quantity along the bottom. They cross once. At that price, the equilibrium price, buyers want to buy exactly the quantity sellers want to sell, the equilibrium quantity. The market clears: nobody who wants to buy at that price goes without, and no seller is left holding goods it wanted to sell.
With equations, set quantity demanded equal to quantity supplied. If $Q_d = 90 - 3P$ and $Q_s = -10 + 2P$:
- $90 - 3P = -10 + 2P$, so $100 = 5P$ and the price is $20.
- Quantity: $90 - 3 \times 20 = 30$ units, and supply gives the same, $-10 + 2 \times 20 = 30$.
This supply-demand model is a tool for explaining prices. Rents differ between two cities because demand or supply differs between them; the price of strawberries falls in June because supply is larger then. When a price or quantity changes, the first question is which curve moved.
Quick check · Calculate
In a competitive market for phone chargers, demand is Qd = 200 − 4P and supply is Qs = −40 + 8P, where P is the price in dollars. What is the equilibrium price, in dollars?
2b. What the price tells people
An equilibrium price is a message, and everyone who meets it reads it.
Suppose demand for electric-car batteries grows and the price of lithium climbs to a new equilibrium. Nobody has to announce a lithium plan.
- Buyers see a pricier input. Battery makers redesign to use less of it, and the lithium goes first to the uses that need it most.
- Sellers see a better reward. Mining companies open new mines and reopen old ones, moving workers and machines into lithium.
A fall in price sends the opposite message: use more freely, produce less, and move resources elsewhere.
That is how a market guides resources without a planner. Each person acts on one number, and the price itself gathers what thousands of buyers and sellers know about how scarce the good is. In Think first, the price and the leftover loaves did that job for the bakers.
Quick check · Fill the statement
Tap a blank, then tap a phrase.
When the market price of copper rises to a new equilibrium, it tells electrical firms that buy copper to and mining companies to .
2c. Consumer and producer surplus
Buyers and sellers both gain from trading at the equilibrium price.
Consumer surplus is the difference between the most buyers would pay and what they do pay. Each point on the demand curve is one buyer's top price (the marginal benefit of that unit), so consumer surplus is the area below the demand curve and above the price, out to the quantity bought.
Producer surplus is the difference between the price sellers receive and the least they would accept. Each point on the supply curve is the lowest price for that unit, so producer surplus is the area above the supply curve and below the price.
With straight lines both areas are triangles, and a triangle's area is ½ × base × height. Say demand meets the price axis at $50, supply meets it at $12, and they cross at $30 and 100 units.
- Consumer surplus: ½ × 100 × ($50 − $30) = $1,000.
- Producer surplus: ½ × 100 × ($30 − $12) = $900.
The base is always the quantity traded, and the height is measured from the price.
Quick check · Calculate
In a competitive market, the straight-line demand curve meets the price axis at $40, the straight-line supply curve meets it at $10, and the two cross at a price of $28 and a quantity of 60 units. What is consumer surplus, in dollars?
2d. Why equilibrium is efficient
Add the two areas and you get total economic surplus, the whole gain the market creates. In a competitive market with no market failures, equilibrium makes that total as large as it can be.
Follow the units in order along the quantity axis. Left of the equilibrium quantity, each unit's height on the demand curve (what a buyer would pay) is above its height on the supply curve (what it costs a seller to provide). Trading it adds to total surplus, and at equilibrium every such unit is traded.
Right of the equilibrium quantity it flips. Each extra unit would cost sellers more than any remaining buyer would pay, so making it would use up more than it is worth.
Stop short of equilibrium and some gains are never made; go past it and units are made that are worth less than they cost. Only the equilibrium quantity avoids both, which is what economists mean when they call perfectly competitive markets efficient.
Quick check · Multiple choice
A competitive market with no market failures is in equilibrium. A planner orders sellers to produce and sell 20 more units than the equilibrium quantity. What happens to total economic surplus in this market?
Part 3 Watch it done One market, both surpluses
Follow each step, then finish the last one yourself.
In a competitive market for yoga classes, demand is Qd = 120 − 2P and supply is Qs = −30 + 3P, where P is the price in dollars and Q is classes per month. Find the equilibrium, then consumer surplus and producer surplus.
Step 1 · Equilibrium
Set 120 − 2P = −30 + 3P. Then 150 = 5P, so the price is $30. The quantity is 120 − 2 × 30 = 60 classes.
Step 2 · Where each curve meets the price axis
Demand reaches zero classes when 120 − 2P = 0, at $60. Supply starts when −30 + 3P = 0, at $10.
Step 3 · Consumer surplus
The triangle below demand and above the price has base 60 and height $60 − $30 = $30: ½ × 60 × 30 = $900.
Why this step?
Why is the base 60, and not the 120 classes demanded at a price of zero?
Surplus comes only from classes actually bought and sold. At the equilibrium price 60 classes are traded; buyers who would only take classes at lower prices buy none and gain nothing.
Your step · Calculate
Now finish it: the supply curve meets the price axis at $10, the equilibrium price is $30, and 60 classes are traded. What is producer surplus, in dollars?
dollars
Part 4 Try it New markets, your turn
Part 5 Explain it Answer a short free-response question
Nothing you type leaves this page. Draw the graph on paper, then compare it with the model.
Free response is 33.35% of the exam score. This one is shaped like Question 2, Short.
Free-response practice · Question 2 style
The market for reusable water bottles is perfectly competitive and in equilibrium at a price of $12 and a quantity of 500 bottles a week. (a) Draw a correctly labeled graph of the market, and show the equilibrium price and quantity, labeled $12 and 500. (b) On your graph, shade the area of consumer surplus and label it CS. (c) The demand curve is a straight line that meets the price axis at $20. Calculate consumer surplus. Show your work. (d) Explain why total economic surplus in this market is as large as possible at a quantity of 500 bottles.
Model answer
(a) Price on the vertical axis and quantity on the horizontal axis, with a downward-sloping demand curve and an upward-sloping supply curve crossing at $12 and 500 bottles. (b) The triangle below demand, above the $12 price line, from 0 to 500 bottles. (c) ½ × 500 × ($20 − $12) = ½ × 500 × 8 = $2,000. (d) For every bottle up to 500, some buyer values it more than it costs a seller to make, so trading it adds surplus. Past 500, each bottle would cost more to make than any remaining buyer would pay, so making it would lower total surplus.
The market for reusable water bottles
Consumer surplus is the shaded area below demand and above $12; producer surplus is the area above supply and below $12.
Score your own answer. This is a self-check, not a grade. Tick each point your answer makes.
Part 6 Check yourself Read a market graph
The case questions can all be answered from this graph.
The graph shows straight-line demand and supply in a perfectly competitive market for picnic tables. Point A is where demand meets the price axis, point B is where supply meets it, and point E is where the two curves cross.
The market for picnic tables
Demand meets the price axis at $90 and supply at $15; they cross at $45 and 30 tables a week.
Case question 1 · Calculate
What is producer surplus in the picnic table market, in dollars per week?
Case question 2 · Match
Tap a measure, then tap the area on the graph that shows it.
Case question 3 · Decide and justify
At the 35th picnic table, the demand curve's height is $37.50 and the supply curve's height is $50. Is the 35th table bought and sold when this market is in equilibrium?
Which reason supports your choice?
The rest stand on their own and do not use the case.
Check yourself · Sort it
Tap a trade, then tap whose surplus it describes.
Consumer surplus
Producer surplus
Check yourself · Spot the error
In a competitive market, straight-line demand meets the price axis at $30, straight-line supply meets it at $6, and they cross at $18 and 400 units. A student worked out both surpluses. Tap the first line with a mistake.
Check yourself · Multiple choice
A ski town has the same hotels and the same number of rooms all year, and running a room costs the same in every month. A room costs $240 a night in January and $110 a night in May. Which explanation fits the supply-demand model?
Part 7 Keep it Keep it
From 2.5 Other Elasticities · Calculate
When a household's income rises from $40,000 to $60,000 a year, with prices unchanged, its restaurant meals rise from 10 to 14 a month. Using the midpoint method, what is its income elasticity of demand for restaurant meals? Round to two decimal places, and give a negative number if it is negative.
A new situation. Decide, then pick the reason that supports your decision.
From 1.5 Cost-Benefit Analysis · Decide and justify
Ferris County is deciding whether to build a library branch. It can build the branch as planned or not at all. Over its life, the branch would give residents benefits worth $8 million. The county would pay builders $5 million. The branch would go on a county lot that the county now leases to a car dealer, and it would lose $4 million of lease payments over the same years. Should the county build the branch?
Which reason supports your choice?
In three lines
- At the equilibrium price buyers want exactly what sellers offer, with nothing left on the shelf and nobody turned away who will pay that price.
- The equilibrium price tells buyers how sparingly to use a good and sellers how much to make.
- Consumer surplus lies below demand and above the price, producer surplus above supply and below it, and their total is largest at equilibrium.
Exam strategy for this topic
- Section I, Multiple Choice: 60 questions in 70 minutes.
- Section II, Free Response: 3 questions in 60 minutes.
- This lesson's Explain it is shaped like free-response question 2, Short.
- A four-function calculator is allowed on both sections of the exam.
Label both axes, label the curves D and S, and mark the equilibrium price and quantity on the axes with dashed lines. When asked for a surplus, shade the exact triangle, then show ½ × base × height with the numbers you used.
Questions students ask
Does equilibrium mean the price never changes?
No. It is the price the market settles at for given demand and supply. When a determinant shifts either curve, the equilibrium moves, which is the next lesson.
Why is surplus a triangle and not a rectangle?
Buyers have different top prices, falling along the demand curve, so the gap above the price shrinks from one unit to the next. With a straight curve those gaps fill a triangle.
Is buyers' spending part of total surplus?
No. What buyers pay, sellers receive, so spending moves money from one side to the other and adds nothing to the total gain.
What does 'in the absence of market failures' mean here?
It means no one outside the market bears a cost or gets a benefit from the trade, and buyers and sellers are many and well informed. Later units cover what happens when that is not so.
Does the equilibrium price tell anyone what to do?
It tells everyone at once without any order: a high price signals buyers to economize and sellers to produce more, and a low price the reverse.
Course alignment, for teachers
AP Microeconomics topic 2.6, Unit 2: Supply and Demand.
- Skill 2.A: Using economic concepts, principles, or models, explain how a specific economic outcome occurs or what action should be taken in order to achieve a specific economic outcome.
This lesson maps all 5 essential knowledge statements of the topic to the part that teaches each one: 5 are checked by a scored question. The map is in the lesson file.