Unit 2 · Topic 2.7 · about 30 minutes · 7 parts · 10 scored checks, 1 of them multiple choice, plus 2 from earlier lessons
AP Microeconomics 2.7: Market Disequilibrium and Changes in Equilibrium
Unit 2: 20 to 25% of the multiple-choice section
What you'll be able to do
- Define a surplus and a shortage, explain with a graph how a change in market conditions moves price, quantity, consumer surplus and producer surplus, and calculate those changes from a graph or table.
Key vocabulary
| Term | What it means | The exam trap |
|---|---|---|
| Equilibrium | The price at which quantity demanded equals quantity supplied, and the quantity traded there. | Equilibrium is about the two quantities matching, not about the quantity being as large as possible. |
| Disequilibrium | Any price at which quantity demanded and quantity supplied are not equal. | A market can be in disequilibrium even when nothing is wrong with buyers or sellers; the price simply has not settled yet. |
| Shortage | The amount by which quantity demanded is greater than quantity supplied at a given price. | A shortage is not scarcity. Scarcity holds at every price; a shortage belongs to one price. |
| Surplus | The amount by which quantity supplied is greater than quantity demanded at a given price. | This surplus counts unsold goods. Consumer and producer surplus are something else: dollar areas of benefit on a graph. |
| Consumer surplus | The difference between what buyers are willing to pay and what they actually pay, added up over every unit bought. | It is measured in dollars as an area, never as a number of units. |
| Producer surplus | The difference between the price sellers receive and the least they would accept, added up over every unit sold. | Producer surplus is not the same as profit; it is measured against the supply curve. |
 Tap to open the picture full size
Part 1 Think first The line outside the bakery
Make a guess first. Even a wrong guess helps the answer stick.
Predict first
A bakery starts selling a new filled croissant for $3. Every morning about 60 people are waiting when it opens, and the croissants are gone within 20 minutes. Its ovens can only bake the same number each day. If nothing else changes, what is the bakery most likely to do over the next few weeks?
In short. A market is in disequilibrium when its price leaves quantity demanded and quantity supplied unequal, and a change in demand or supply moves the equilibrium to a new price, a new quantity and new amounts of consumer and producer surplus.
- Above the equilibrium price sellers offer more than buyers want; below it buyers want more than sellers offer.
- A gap like that sets the price moving, and the price keeps moving until the two quantities match again.
- A shift of one curve moves the market along the other curve, and how the price and quantity split the change depends on how responsive buyers and sellers are.
Part 2 Learn it Four ideas, with a check after each
2a. Out of balance: surplus and shortage
At the equilibrium price, the amount buyers want equals the amount sellers offer. At any other price the market is in disequilibrium, and one side is left wanting.
- If the price is above equilibrium, sellers offer more than buyers will take. The extra is a surplus: quantity supplied minus quantity demanded.
- If the price is below equilibrium, buyers want more than sellers offer. The missing amount is a shortage: quantity demanded minus quantity supplied.
Both are measured at one particular price, so read the row for that price and nothing else.
| Price | Quantity demanded | Quantity supplied | At this price |
|---|---|---|---|
| $8 | 90 | 30 | Shortage of 60 |
| $12 | 70 | 50 | Shortage of 20 |
| $14 | 60 | 60 | Equilibrium |
| $18 | 40 | 80 | Surplus of 40 |
A shortage is not the same thing as scarcity. Phone cases are scarce at every price, because making them uses resources. The shortage at $8 exists only because the price is low; at $14 it is gone.
Quick check · Calculate
A weekly market for houseplants has this schedule. At $4, buyers want 500 plants and growers offer 200. At $6, buyers want 400 and growers offer 300. At $8, buyers want 300 and growers offer 400. At $10, buyers want 200 and growers offer 500. If the growers charge $10, how large is the surplus, in plants?
2b. The price does the correcting
A surplus or a shortage does not last in a market where the price is free to move.
With a surplus, unsold goods pile up, and sellers cut the price to clear them. The lower price does two things at once: buyers move down the demand curve and buy more, and sellers move down the supply curve and offer less. The surplus shrinks from both ends.
With a shortage, buyers compete for too few goods, and sellers find they can charge more. The higher price leads buyers to buy less and sellers to offer more, so the shortage closes from both ends.
In both cases the price keeps moving until quantity demanded equals quantity supplied, which is the equilibrium again. Notice what did not happen: neither curve moved. The surplus and the shortage were closed by movements along the curves, caused by a change in the good's own price. A curve shifts only when something other than the good's own price changes.
Quick check · Decide and justify
At this week's fares, airlines have many more seats on flights to a holiday resort than travelers want to buy. Fares are free to change. What happens next?
Which reason supports your choice?
2c. When a curve shifts
A change in a determinant of demand or supply (income, the price of a related good, an input cost, technology) shifts one curve, and the market moves to a new equilibrium along the curve that stayed put. Work it in three steps.
- Decide which curve the news affects: buyers' willingness to buy, or sellers' willingness to sell.
- Decide which way it shifts.
- Find where the shifted curve crosses the curve that did not move, and read the new price and quantity.
The four single shifts give four patterns.
| Shift | Price | Quantity |
|---|---|---|
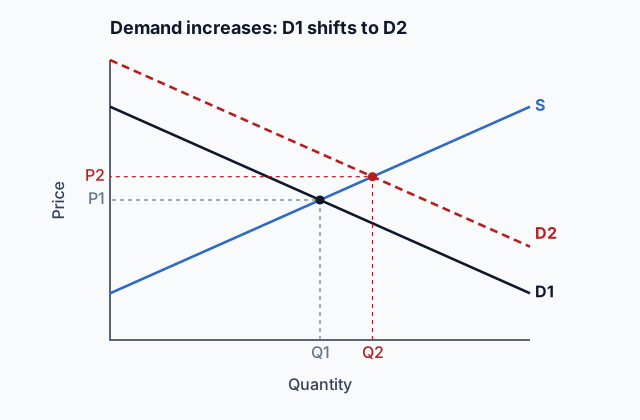
| Demand increases (right) | Rises | Rises |
| Demand decreases (left) | Falls | Falls |
| Supply increases (right) | Falls | Rises |
| Supply decreases (left) | Rises | Falls |
A memory aid: a demand shift moves price and quantity the same way, and a supply shift moves them in opposite ways. Do not memorize the table without the graph, though. Sketch the curves and the shift each time. If you forget the table on the exam, the sketch gives it back.
Quick check · Match
Each situation happens in the market for blueberries, which starts in equilibrium. Tap a situation, then tap what happens to the equilibrium price and quantity of blueberries.
2d. Surplus, and why elasticity matters
A shift also changes consumer surplus and producer surplus, and so the total surplus in that market.
The side whose curve stayed put is the easy one to judge. When supply shifts, demand is unchanged, so consumer surplus moves opposite to the price: a supply decrease raises the price and cuts consumer surplus. When demand shifts, supply is unchanged, so producer surplus moves with the price: a demand increase raises it. With straight-line curves you can go further and compute each triangle before and after, as the worked example does. Total surplus is the two added together, and when a decrease in either curve shrinks the quantity traded, total surplus in that market falls.
The size of the price and quantity changes depends on elasticity. Say the same supply decrease hits two markets.
- Where demand is inelastic (buyers have few substitutes), buyers keep buying as the price climbs, so the price rises a lot and the quantity falls a little.
- Where demand is elastic (many substitutes), buyers walk away quickly, so the price rises a little and the quantity falls a lot.
The same reasoning runs the other way for a demand shift: the more elastic supply is, the more of the change shows up in quantity rather than price.
Quick check · Decide and justify
The same decrease in supply hits two markets. In market A, buyers have many close substitutes. In market B, buyers have almost none. In which market does the equilibrium price rise more?
Which reason supports your choice?
Part 3 Watch it done Flour costs more
Follow each step, then finish the last one yourself.
A town's market for bread is perfectly competitive. Demand is P = 18 − 0.02Q and supply is P = 2 + 0.02Q, with P in dollars per loaf and Q in loaves a day. Then the price of flour rises, and supply becomes P = 6 + 0.02Q. Find what happens to the price, the quantity and consumer surplus.
Step 1 · The starting equilibrium
Set demand equal to supply: 18 − 0.02Q = 2 + 0.02Q, so 0.04Q = 16 and Q = 400 loaves. The price is 18 − 0.02 × 400 = $10. Consumer surplus is the triangle under demand and above $10: ½ × 400 × (18 − 10) = $1,600.
Step 2 · The new equilibrium
The flour price moves supply up by $4 at every quantity. Now 18 − 0.02Q = 6 + 0.02Q, so 0.04Q = 12 and Q = 300 loaves, at a price of 18 − 0.02 × 300 = $12.
Why this step?
Why does the price rise only $2 when each loaf costs $4 more to bake?
As the price climbs, buyers move up the demand curve and buy fewer loaves. The market settles where what buyers want at the new price matches what bakers will sell with their higher costs, and that happens before the whole $4 reaches buyers. How the change splits between price and quantity depends on how steep the two curves are.
Step 3 · The new consumer surplus
The triangle is now under demand and above $12, out to 300 loaves: ½ × 300 × (18 − 12) = $900, down from $1,600. Producer surplus is the other triangle, above the supply curve and below the price, so it starts from wherever supply meets the price axis.
Your step · Calculate
In the bread market, 400 loaves sold at $10 before the flour price rose, with supply starting at $2. Afterward, 300 loaves sell at $12, and supply starts at $6. Consumer surplus fell from $1,600 to $900. By how many dollars did total surplus (consumer surplus plus producer surplus) fall?
dollars
Part 4 Try it Shift the curves yourself
Before each check, say out loud what happens to the price and the quantity, and which surplus you can be sure of: the one on the side whose curve did not move.
Part 5 Explain it Answer a short free-response question
Nothing you type leaves this page. Draw the graph on paper, then compare it with the model.
Free response is 33.35% of the exam score. This one is shaped like Question 2, Short.
Free-response practice · Question 2 style
Before Halloween, the market for pumpkins in a town is perfectly competitive and in equilibrium. (a) Draw a correctly labeled graph of the pumpkin market, and mark the equilibrium price P1 and quantity Q1. (b) The day after Halloween, buyers want far fewer pumpkins at every price. On your graph, show this change, and mark the new equilibrium price P2 and quantity Q2. (c) If sellers kept asking P1 the day after Halloween, would the market have a shortage or a surplus? Explain. (d) What happens to producer surplus? Explain.
Model answer
(a) A graph with price up the side and quantity of pumpkins along the bottom, where a falling demand curve D1 meets a rising supply curve S at P1 and Q1. (b) Demand moves left to D2, which meets S at a lower price P2 and a smaller quantity Q2. (c) A surplus. At P1 sellers would still offer Q1 pumpkins, but buyers now want fewer, so pumpkins would sit unsold until sellers cut the price. (d) Producer surplus falls. Supply did not move, and sellers now receive a lower price on fewer pumpkins, so the area above S and below the price shrinks.
Demand for pumpkins falls
Demand moves from D1 to D2 while supply stays put, so the price falls from P1 to P2 and the quantity from Q1 to Q2.
Score your own answer. This is a self-check, not a grade. Tick each point your answer makes.
Part 6 Check yourself Read one market's schedule
The case questions can all be answered from this table.
Many shops near a college sell plain hooded sweatshirts, and the market is perfectly competitive. Then the price of cotton rises sharply. The table shows the weekly market schedule before and after.
| Price | Quantity demanded | Quantity supplied before | Quantity supplied after |
|---|---|---|---|
| $20 | 600 | 200 | 0 |
| $25 | 500 | 300 | 100 |
| $30 | 400 | 400 | 200 |
| $35 | 300 | 500 | 300 |
| $40 | 200 | 600 | 400 |
Case question 1 · Multiple choice
Right after the cotton price rises, the shops keep charging $30 for a short time. What does the market for sweatshirts have at $30?
Case question 2 · Calculate
What is the new equilibrium price of a sweatshirt, in dollars, after the cotton price rises?
Case question 3 · Fill the statement
Tap a blank, then tap a word.
Once the market settles at its new equilibrium, sweatshirts sell for a price than before, and consumer surplus .
The rest stand on their own and do not use the case.
Check yourself · Spot the error
A pipeline that carries gasoline to a region breaks. A student explained what happens in the region's gasoline market. Tap the first line with a mistake.
Check yourself · Select all
A fire at a factory decreases the supply of a flu vaccine. Demand for the vaccine is very inelastic. Which two statements are correct? Select two.
Select 2 answers, then check.
Part 7 Keep it Keep it
From 2.6 Market Equilibrium and Consumer and Producer Surplus · Calculate
In a competitive market for phone chargers, demand is Qd = 200 − 4P and supply is Qs = −40 + 8P, where P is the price in dollars. What is the equilibrium price, in dollars?
From 2.4 Price Elasticity of Supply · Sort it
Tap a description of a seller's supply over one price range, then tap the label it earns.
Elastic
Inelastic
Unit elastic
In three lines
- Above equilibrium there is a surplus and below it a shortage, and the price moves until the two quantities match.
- A demand shift moves price and quantity the same way; a supply shift moves them in opposite ways.
- Elasticity decides how a shift splits between a change in price and a change in quantity.
Exam strategy for this topic
- Section I, Multiple Choice: 60 questions in 70 minutes.
- Section II, Free Response: 3 questions in 60 minutes.
- This lesson's Explain it is shaped like free-response question 2, Short.
- A four-function calculator is allowed on both sections of the exam.
When a graph question says a curve shifts, draw the new curve, label it (S2 or D2), and label both equilibria P1, Q1 and P2, Q2 on the axes. For a shortage or surplus, name the two quantities at the stated price before you say which one is larger.
Questions students ask
Why does a shortage push the price up instead of shifting demand?
Buyers who cannot get the good offer more and sellers charge more. The higher price moves buyers along their demand curve to a smaller quantity demanded. Demand shifts only when something other than the good's own price changes.
How do I tell a surplus from a shortage on a graph?
Draw a horizontal line at the price. If it is above the crossing, the supply curve is farther right at that price: a surplus. Below the crossing, demand is farther right: a shortage.
Which surplus can I be sure of after a shift?
The one on the side whose curve stayed put. If supply shifts, consumer surplus moves opposite to the price. If demand shifts, producer surplus moves with the price.
Does a steeper curve always mean a smaller change in quantity?
Over the range a graph shows, a steeper demand curve usually stands for less elastic demand, so a supply shift moves the price more and the quantity less. Elasticity still changes along a straight line, so compare curves over the same stretch of the graph.
What if a market is not perfectly competitive?
This lesson uses the competitive model, where many buyers and sellers take the price as given. Markets with a single seller or a few sellers come later in the course.
Course alignment, for teachers
AP Microeconomics topic 2.7, Unit 2: Supply and Demand.
- Skill 3.A: Determine the outcome of an economic situation using economic concepts, principles, or models.
This lesson maps all 2 essential knowledge statements of the topic to the part that teaches each one: 2 are checked by a scored question. The map is in the lesson file.