Unit 2 · Topic 2.8 · about 30 minutes · 7 parts · 10 scored checks, 1 of them multiple choice, plus 2 from earlier lessons
AP Microeconomics 2.8: The Effects of Government Intervention in Markets
Unit 2: 20 to 25% of the multiple-choice section
What you'll be able to do
- Define price controls, quantity controls, per-unit taxes and subsidies, explain with a graph how each changes what buyers and sellers do, and calculate the results, including tax revenue, subsidy cost and deadweight loss.
Key vocabulary
| Term | What it means | The exam trap |
|---|---|---|
| Price ceiling | A legal maximum price for a good or service. | The name tells you the direction of the limit: prices may not rise past it. Decide whether it binds by comparing it with the equilibrium price. |
| Price floor | A legal minimum price for a good or service. | Do not read floor as low on the graph. Its height is set by the law, so compare it with the equilibrium price before drawing anything. |
| Per-unit tax | A tax of a fixed dollar amount on each unit of a good sold. | It is a set amount per unit, such as $1 a pack, not a percentage of the price. |
| Per-unit subsidy | A fixed payment from the government for each unit of a good produced or sold. | Here a subsidy is tied to each unit, not a single lump sum paid whatever a firm does. |
| Deadweight loss | The total surplus lost when the quantity traded moves away from the efficient quantity. | It is a loss to society as a whole, so it shows up on nobody's receipt. |
| Tax incidence | How the burden of a tax is divided between buyers and sellers. | Incidence is measured in dollars per unit for each side. It is not the same thing as tax revenue. |
 Tap to open the picture full size
Part 1 Think first A cap on rent
Make a guess first. Even a wrong guess helps the answer stick.
Predict first
In a city where apartments rent for $1,500 a month, the council passes a law that no apartment may rent for more than $1,200. A year later, which of these would you expect to see?
In short. When a government sets a legal price, limits a quantity, or taxes or subsidizes each unit of a good, buyers and sellers respond to the new incentives, and in a competitive market that was already efficient the result is less total surplus than before.
- A binding ceiling holds the price below equilibrium and a binding floor holds it above, so the quantity traded falls in both cases.
- A per-unit tax shifts supply up by the tax and raises revenue; a per-unit subsidy shifts it down and costs the government money.
- How a tax splits between buyers and sellers depends on elasticity, and the trades that no longer happen are the deadweight loss.
Part 2 Learn it Four ideas, with a check after each
2a. Legal prices: ceilings and floors
A price ceiling is a legal maximum price, and a price floor is a legal minimum. Each matters only if it stops the market from reaching its equilibrium price.
- A binding ceiling sits below the equilibrium price. Buyers want more at the low price and sellers offer less, so there is a shortage. Only as many units trade as sellers offer: the quantity supplied.
- A binding floor sits above the equilibrium price. Sellers offer more and buyers want less, so there is a surplus. Only as many units trade as buyers take: the quantity demanded.
A ceiling set above the equilibrium price, or a floor set below it, leaves the market where it was.
Governments also limit quantities directly, such as a cap on how many fishing licenses are issued. A cap below the equilibrium quantity also cuts the quantity traded.
Controls like these change incentives in any market, whether it has many sellers or one. This lesson works with competitive markets.
Quick check · Fill the statement
Tap a blank, then tap a word.
A government sets a legal maximum price on bread below the equilibrium price. This causes a of bread, and the amount of bread actually bought and sold equals the quantity .
2b. Taxes and subsidies on each unit
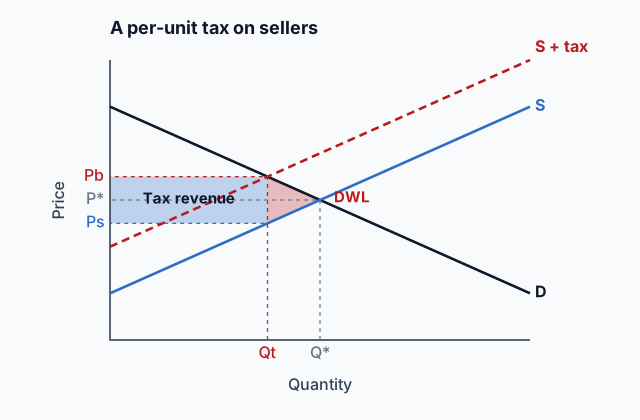
A per-unit tax is a fixed amount charged on each unit sold, such as $1 a pack. Collected from sellers, it raises their cost of supplying every unit by the tax, so the supply curve shifts up by exactly the tax (which is also a shift to the left). The government collects tax revenue = tax × quantity sold after the tax.
A per-unit subsidy is a fixed payment for each unit. Paid to sellers, it lowers their cost of supplying every unit, so supply shifts down by the subsidy (to the right). It costs the government subsidy × quantity sold after the subsidy.
The new curve changes the incentives on both sides:
- With the tax, buyers pay more, sellers keep less, and fewer units are traded.
- With the subsidy, buyers pay less, sellers receive more once the payment is added, and more units are traded.
Watch the quantity in the revenue or cost: it is the quantity after the policy, because that is how many units the tax or subsidy is actually charged or paid on.
Quick check · Sort it
Each statement describes one policy placed on the sellers in a competitive market. Tap a statement, then tap the policy it describes.
Per-unit tax
Per-unit subsidy
2c. Deadweight loss
A perfectly competitive market with no market failure already trades the efficient quantity: every unit buyers value above its cost gets made, and no other. Any of these policies that binds pushes the quantity away from that point, so in such a market it can only lower total surplus. (A control that does not bind changes nothing.)
The surplus that disappears and goes to nobody is the deadweight loss.
- A tax, a binding ceiling or a binding floor cuts the quantity, and the surplus on the lost units is gone.
- A subsidy raises the quantity past the efficient point. The extra units cost more to make than buyers value them at.
With straight-line curves, deadweight loss is a triangle. For a tax it sits between the old and new quantities, with a height equal to the tax:
Deadweight loss = ½ × quantity lost × tax
For a binding ceiling or floor, the triangle runs from the quantity traded to the equilibrium quantity. Its height is the gap, at the quantity traded, between what buyers would pay (on the demand curve) and the least sellers would accept (on the supply curve). Say 60 units trade, equilibrium is 70, and for the 60th unit buyers would pay $9 and sellers accept $5: the loss is ½ × 10 × 4 = $20.
Tax revenue is not part of the loss. It moves from buyers and sellers to the government, and still counts in total surplus.
Quick check · Calculate
In a perfectly competitive market for plastic bags, 600 bags a week are sold at equilibrium. A tax of $5 on each bag cuts the quantity sold to 480 bags a week. Demand and supply are straight lines. What is the deadweight loss of the tax, in dollars a week?
2d. Who really pays a tax
Who sends the money to the government does not decide who bears a tax. The incidence of a tax is how its burden splits: how much the price buyers pay rises, and how much the price sellers keep falls.
The side that is less elastic bears more of it.
- If buyers have few substitutes (inelastic demand), they keep buying as the price rises, so sellers can pass most of the tax on. Buyers bear more.
- If sellers cannot easily cut production or move to another market (inelastic supply), they accept a lower price rather than sell much less. Sellers bear more.
A tax on gasoline, with few short-run substitutes, falls mostly on drivers. A tax on a brand of soft drink, with many substitutes on the same shelf, falls mostly on the seller.
The same rule holds for a subsidy: the less elastic side gets more of the benefit.
Quick check · Decide and justify
People who need insulin have almost no substitute for it, so demand is very inelastic, while supply is fairly elastic. A $5 per-unit tax on insulin is collected from sellers. Who bears most of the tax?
Which reason supports your choice?
Part 3 Watch it done A tax on movie tickets
Follow each step, then finish the last one yourself.
A city's market for movie tickets is perfectly competitive. Demand is P = 16 − 0.02Q and supply is P = 4 + 0.01Q, with P in dollars and Q in tickets a night. The city adds a tax of $3 a ticket, collected from theaters. Find the new quantity, the price buyers pay and the price theaters keep, the tax revenue and the deadweight loss.
Step 1 · Before the tax
Set demand equal to supply: 16 − 0.02Q = 4 + 0.01Q, so 0.03Q = 12 and Q = 400 tickets, at $8 each.
Step 2 · With the tax
The tax moves supply up by $3: P = 7 + 0.01Q. Now 16 − 0.02Q = 7 + 0.01Q, so 0.03Q = 9 and Q = 300 tickets. Buyers pay 16 − 0.02 × 300 = $10, and theaters keep 10 − 3 = $7.
Why this step?
Why do buyers end up paying $2 more while theaters keep only $1 less?
Demand is steeper than supply here, so over this range buyers respond less to the price than theaters do. The less responsive side bears more of the tax: $2 of the $3 lands on buyers.
Step 3 · Tax revenue
The tax is charged on the 300 tickets still sold: 3 × 300 = $900 a night.
Your step · Calculate
Before the $3 tax, 400 movie tickets a night sold at $8. After it, 300 sell, buyers pay $10 and theaters keep $7. Demand and supply are straight lines. What is the deadweight loss of the tax, in dollars a night?
dollars
Part 4 Try it Set the policy yourself
Part 5 Explain it Answer a short free-response question
Nothing you type leaves this page. Draw the graph on paper, then compare it with the model.
Free response is 33.35% of the exam score. This one is shaped like Question 3, Short.
Free-response practice · Question 3 style
The market for electric scooters is perfectly competitive and in equilibrium. (a) Draw a correctly labeled graph of the market, and label the equilibrium price P1 and quantity Q1. (b) The government pays sellers a fixed subsidy for every scooter sold. On your graph, show the effect, and label the price buyers now pay Pb and the new quantity Q2. (c) On your graph, shade the deadweight loss caused by the subsidy. (d) Is the government's spending on the subsidy greater than, less than or equal to the total gain to buyers and sellers? Explain.
Model answer
(a) Price on the vertical axis and quantity on the horizontal axis, a downward-sloping demand curve D and an upward-sloping supply curve S1 crossing at P1 and Q1. (b) Supply shifts down (to the right) by the subsidy, to S2. Where S2 crosses D, the quantity Q2 is larger than Q1 and the price buyers pay, Pb, is lower than P1. (c) The deadweight loss is the triangle between S1 above and D below, from Q1 to Q2: the extra scooters cost more to make than buyers value them at. (d) Greater. The government pays the subsidy on every scooter, including the extra ones whose cost is more than their value to buyers, so the gains to buyers and sellers fall short of the spending by the deadweight loss.
A per-unit subsidy to sellers
Supply shifts down from S1 to S2. The quantity rises from Q1 to Q2 and the price buyers pay falls to Pb. The deadweight loss is the triangle with corners at E1, E2 and F, the point on S1 directly above Q2.
Score your own answer. This is a self-check, not a grade. Tick each point your answer makes.
Part 6 Check yourself A floor under milk
The case questions can all be answered from this table.
To support dairy farmers, a government sets a price floor of $5 a gallon on milk. The market is perfectly competitive, its demand and supply are straight lines, and the government does not buy any milk itself. The table shows weekly quantities in millions of gallons.
| Price per gallon | Quantity demanded (millions) | Quantity supplied (millions) |
|---|---|---|
| $2 | 90 | 50 |
| $3 | 80 | 60 |
| $4 | 70 | 70 |
| $5 | 60 | 80 |
| $6 | 50 | 90 |
Case question 1 · Calculate
How large is the surplus of milk at the price floor, in millions of gallons a week?
Case question 2 · Multiple choice
How much milk is actually bought and sold each week under the floor?
Case question 3 · Calculate
What is the deadweight loss of the price floor, in millions of dollars a week?
The rest stand on their own and do not use the case.
Check yourself · Select all
A perfectly competitive market for solar panels is in equilibrium. The government starts paying sellers $1 for every panel sold. Which two statements are correct? Select two.
Select 2 answers, then check.
Check yourself · Spot the error
A $2 per-unit tax is placed on sellers of concert tickets in a competitive market. Demand for the tickets is elastic, and supply is inelastic. A student explained the effects. Tap the first line with a mistake.
Part 7 Keep it Keep it
From 2.7 Market Disequilibrium and Changes in Equilibrium · Calculate
A weekly market for houseplants has this schedule. At $4, buyers want 500 plants and growers offer 200. At $6, buyers want 400 and growers offer 300. At $8, buyers want 300 and growers offer 400. At $10, buyers want 200 and growers offer 500. If the growers charge $10, how large is the surplus, in plants?
From 2.1 Demand · Sort it
Tap a situation, then tap whether it is an incentive or a constraint for the buyer.
Incentive
Constraint
In three lines
- A binding ceiling sits below equilibrium and causes a shortage; a binding floor sits above it and causes a surplus.
- A per-unit tax shifts supply up and raises revenue; a subsidy shifts it down and costs money; both leave a deadweight loss in an efficient market.
- The less elastic side of the market bears more of a tax.
Exam strategy for this topic
- Section I, Multiple Choice: 60 questions in 70 minutes.
- Section II, Free Response: 3 questions in 60 minutes.
- This lesson's Explain it is shaped like free-response question 3, Short.
- A four-function calculator is allowed on both sections of the exam.
On a tax graph, label the price buyers pay, the price sellers keep and the new quantity, and say which rectangle is revenue and which triangle is deadweight loss. For a price control, say first whether it binds, then read both quantities at the legal price.
Questions students ask
How do I know whether a ceiling or a floor binds?
Compare it with the equilibrium price. A ceiling binds only below it and a floor only above it. Otherwise the market reaches equilibrium anyway and nothing changes.
Does it matter whether a tax is collected from buyers or sellers?
Not for the outcome. Collected from buyers, the tax shifts demand down by the tax instead of shifting supply up, and the prices each side ends up paying and keeping come out the same.
Why is tax revenue not part of deadweight loss?
Revenue is surplus that moves from buyers and sellers to the government, and it still counts in total surplus. Deadweight loss is surplus nobody gets, from trades that no longer happen.
If a subsidy lowers prices and raises output, how can it cause a loss?
It pays for units whose cost of production is higher than what buyers value them at. The government's spending is larger than the gains to buyers and sellers, and the gap is the deadweight loss.
Are these policies always a bad idea?
This lesson is about markets that were already efficient, where they can only lower total surplus. Governments may still choose them for other goals, such as helping a group of buyers or sellers. Markets that are not efficient on their own come later in the course.
Course alignment, for teachers
AP Microeconomics topic 2.8, Unit 2: Supply and Demand.
- Skill 4.C: Demonstrate the effect of a change in an economic situation on an accurately labeled graph or visual.
This lesson maps all 6 essential knowledge statements of the topic to the part that teaches each one: 6 are checked by a scored question. The map is in the lesson file.