Unit 1 · Topic 1.13 · about 30 minutes · 7 parts · 12 scored checks, 1 of them multiple choice
Function Model Selection and Assumption Articulation
 Tap to open the picture full size
Part 1 Think first
What shape is a phone bill?
Guess before you learn. A wrong guess still makes the answer stick.
Predict first
A phone plan costs 30 dollars a month for up to 5 gigabytes of data, then 10 dollars for each extra gigabyte. What kind of function models the monthly bill against the data used?
In short. Choosing a model means matching the way a situation changes to a function type, then saying what the model assumes and where it applies.
- Roughly constant rates of change suggest linear; roughly linear rates, or symmetry around one maximum or minimum, suggest quadratic; constant nonzero th differences suggest degree .
- Area suggests quadratic and volume suggests cubic; several zeros or turns suggest a higher-degree polynomial; different behavior on different intervals suggests piecewise.
- Every model assumes something stays consistent, and may need domain or range restrictions from the math, the context or the data.
Part 2 Learn it
Four short ideas, each checked as you go
2a. Read the rates
With data at equally spaced inputs, the differences tell you the type (1.3 and 1.5).
- Roughly constant rates of change: a linear model.
- Rates of change that are roughly linear, so second differences are roughly constant: a quadratic model.
- Roughly constant nonzero th differences: a polynomial of degree .
Measured data wobble a little, so the test is whether the differences are roughly constant. Differences of 2.9, 3.1, 3.0, 2.8 are close enough to constant for a linear model; 3, 5, 7, 9 are clearly not.
Quick check · Sort it
No calculator. Each list gives outputs at inputs 0, 1, 2, 3, 4. Tap a list, then the polynomial type that fits it best.
Linear
Quadratic
Cubic
2b. Read the situation
Sometimes the context says which type to try before you see any data.
- A quantity with a unique maximum or minimum and roughly symmetric behavior around it, like a thrown ball's height: quadratic.
- Area, or anything in two dimensions, often grows like a quadratic. Volume, in three dimensions, often grows like a cubic.
- Several real zeros or several maximums and minimums, like a road over three hills: a polynomial of higher degree.
One more fact helps with small data sets: through any points with distinct inputs there is a polynomial of degree or less. Two points fix a line; three points fix a quadratic, or a line if they happen to be on one.
Quick check · Match
No calculator. Tap a situation, then the model type it suggests.
2c. Piecewise-defined models
A piecewise-defined function is a set of functions, each on its own interval, with intervals that do not overlap. It fits a situation that behaves differently over different intervals. The phone plan:
- for
- for
To evaluate it, first decide which interval the input is in, then use only that rule. , because 3 is in the first interval. .
Quick check · Calculate
No calculator. A phone plan costs 30 dollars a month for up to 5 gigabytes of data, then 10 dollars for each extra gigabyte. What is the bill, in dollars, for 8 gigabytes?
2d. Assumptions and restrictions
A model is a simplification, so it assumes things.
- Assumptions about what stays consistent: the price per pound does not change, the weather is like last year's.
- Assumptions about how quantities change together: each extra worker adds the same output.
A model may also need restrictions.
- Domain restrictions come from mathematical clues (no dividing by zero), contextual clues (time cannot be negative) or extreme values in the data (do not use the model far outside the inputs you measured).
- Range restrictions come from the same places, including rounding: a model may give 41.6 tickets, but you sell 41 or 42.
Quick check · Sort it
No calculator. A school models ticket sales for its play. Tap each statement, then what kind of statement it is.
Assumption
Domain restriction
Range restriction
Part 3 Watch it done
Choosing a model for a thrown ball
Watch each step, then do the last one yourself.
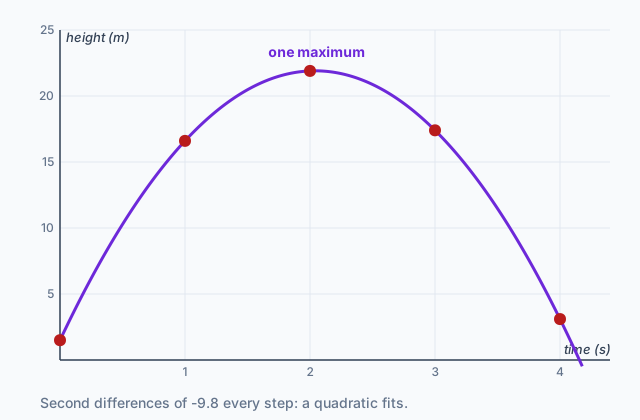
A ball is tossed up from a balcony. Its height in meters, seconds later, is measured:
, , , , .
Choose a model type and state its restrictions.
Step 1 · First differences
, then , and . Not constant, so not linear.
Step 2 · Second differences
, then and . The rates of change are changing at a constant rate, so a quadratic model fits, which matches the rise to one maximum and the fall.
Why this step?
Why not use a degree-4 polynomial, which can pass through all five points?
A polynomial of degree 4 or less fits any five points with distinct inputs, so fitting them proves nothing. The constant second differences show that a quadratic already fits exactly, and it matches how a thrown ball moves.
Step 3 · Restrictions
Time starts at the toss, so , and the model stops when the ball reaches the ground, a little after . Height cannot be negative.
Your step · Calculate
No calculator. Finish it. Suppose you ignore the restriction and keep the second differences at . What height, in meters, does the pattern give for ?
Part 4 Try it
Weather and sales
Try it · Decide and justify
No calculator. A beach stand records its daily lemonade sales at different temperatures. Sales rise as it gets warmer, peak at about 82 degrees, then fall about as fast on the hottest days, when people stay home. Which model type fits?
Which reason supports your answer?
Part 5 Explain it
Write it the way the exam asks
Nothing you type leaves this page.
Free response is 37.5% of the exam score. This one is shaped like Question 2, Modeling a Non-Periodic Context.
Free-response practice · Question 2 style
Graphing calculator required. A city's bike share counted rides each month for its first 8 months. Each month had about 1,200 more rides than the month before. Identify a function type to model rides by month, and justify your choice. Then describe one assumption the model makes and one restriction on its domain.
Model answer
A linear model fits, because the number of rides grew by roughly the same amount, about 1,200, each month: a roughly constant rate of change. The model assumes the growth continues at the same rate, for example that nothing like a price change or a hard winter changes how quickly riders join. Its domain should be restricted to whole months near the data, such as months 1 to 8 or a little beyond, because using it years into the future would predict growth the city may never see.
Score your own answer. This is a self-check, not a grade. Tick each point your answer makes.
Part 6 Check yourself
Shipping a package
The two case questions use the same data. Answer them from the table.
A delivery company lists the cost to ship a package by its weight, in dollars.
| Weight (pounds) | Cost (dollars) |
|---|---|
| 1 | 8.00 |
| 2 | 8.00 |
| 3 | 8.00 |
| 4 | 8.00 |
| 5 | 9.50 |
| 6 | 11.00 |
| 7 | 12.50 |
| 8 | 14.00 |
Case question 1 · Multiple choice
No calculator. Which model fits the table best?
Case question 2 · Calculate
No calculator. If the pattern continues, what does a 10 pound package cost, in dollars?
The rest stand on their own and do not use the case.
Check yourself · Fill the statement
No calculator. Tap a blank, then tap a number.
Through any 4 points with distinct inputs there is a polynomial of degree or less, and through any 7 such points there is one of degree or less.
Check yourself · Spot the error
No calculator. A student chooses a model for the area of square tiles with sides 1, 2, 3 and 4 centimeters: 1, 4, 9 and 16 square centimeters. Tap the line with the mistake.
Part 7 Keep it
Bring back earlier ideas
Pulling an older idea back up is what makes it last.
From 1.12 Transformations of Functions · Calculate
No calculator. The point is on the graph of . The corresponding point on the graph of is . What is ?
From 1.6 Polynomial Functions and End Behavior · Decide and justify
No calculator. A biologist's model of a deer population, with in years, fits the first 40 years of data. Should the biologist use it to predict the population after 100 years?
Which reason supports your answer?
In three lines
- Constant rates suggest linear, linear rates or a symmetric single peak suggest quadratic, and constant th differences suggest degree .
- Area suggests quadratic, volume cubic, several turns a higher degree, and different behavior on different intervals a piecewise model.
- State the assumptions a model makes, and restrict its domain and range with math, context or the data.
Vocabulary
- Function model
- A function chosen to describe a data set or a situation.
- Piecewise-defined function
- A set of functions on intervals that do not overlap, each used only on its own interval.
- Assumption
- Something a model treats as consistent, or a way it assumes quantities change together.
- Domain restriction
- A limit on the inputs a model may use, from math, context or the extent of the data.
- Range restriction
- A limit on the outputs, such as rounding to whole numbers or a maximum the context allows.
Course alignment, for teachers
AP Precalculus topic 1.13, Unit 1: Polynomial and Rational Functions.
- Skill 2.A: Identify information from graphical, numerical, analytical, and verbal representations to answer a question or construct a model, with and without technology.
- Skill 3.C: Support conclusions or choices with a logical rationale or appropriate data.
This lesson maps all 11 essential knowledge statements of the topic to the part that teaches each one: 11 are checked by a scored question. The map is in the lesson file.