Unit 1 · Topic 1.14 · about 30 minutes · 7 parts · 12 scored checks, 1 of them multiple choice
Function Model Construction and Application
 Tap to open the picture full size
Part 1 Think first
Twice as far from the speaker
Guess before you learn. A wrong guess still makes the answer stick.
Predict first
A sound meter 2 meters from a speaker reads an intensity of 40 units. You step back to 4 meters, twice as far. About what does the meter read now?
In short. Building a model means turning what you know about a situation into a specific function, then using it to answer questions with the right units.
- A model can be built from restrictions in the context, from transformations of a parent function, or with technology and a linear, quadratic, cubic or quartic regression.
- A piecewise model combines these techniques on different intervals, and quantities that are inversely proportional are often modeled by rational functions.
- A model answers questions about values, rates of change, average rates of change and changing rates, and every answer carries units from the context.
Part 2 Learn it
Four short ideas, each checked as you go
2a. Build it from what you know
Often the context hands you the features of a model, and a parent function plus transformations (1.12) does the rest.
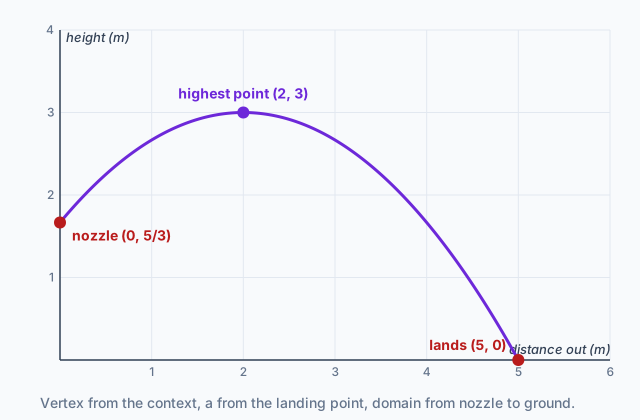
A fountain's arc of water rises to a highest point 3 meters up, 2 meters out from the nozzle, and lands 5 meters out. A quadratic fits the single symmetric maximum, and the vertex gives the transformation:
The landing point is a restriction the model must meet: . So , and . Context also restricts the domain: , from the nozzle to the ground.
Quick check · Calculate
No calculator. A ball's path is modeled by , where and are in meters. It reaches its highest point at and leaves the thrower's hand at . What is ?
2b. Build it with a regression
When a model comes from data, technology can build it. A graphing calculator fits linear, quadratic, cubic and quartic regressions: the polynomial of that degree that comes closest to the data.
Your job is to choose which one to run, using the clues from 1.13: constant differences, a single symmetric peak, area or volume, several turns. The calculator then gives coefficients, which you round sensibly and use.
On the AP Exam a graphing calculator is required for some questions, in multiple-choice Part B and free-response Part A. A regression question would be one of those.
Quick check · Decide and justify
No calculator. A packaging company cuts a square of side centimeters from each corner of a sheet of cardboard and folds up the sides to make an open box. It measures the volume at . The third differences of the volumes are constant and nonzero. Which regression should it run?
Which reason supports your answer?
2c. Build it in pieces
A piecewise-defined model can combine these techniques, one per interval. A rideshare driver's earnings on a shift might be a flat guarantee for the first two hours and a linear rate after that; a car's speed might grow linearly while it accelerates and then stay constant on the highway.
Build each piece from what happens on its interval, and check that the pieces meet where they should. For a car that speeds up from 0 at 3 meters per second each second for 10 seconds, then holds its speed:
- for
- for
Both pieces give 30 at , so the speed has no jump.
Quick check · Fill the statement
No calculator. A bike rental costs 12 dollars for up to 2 hours, then 5 dollars for each extra hour. Tap a blank, then tap a phrase.
The cost model has for and for .
2d. Inverse proportion and rational models
Two quantities are inversely proportional when one is a constant divided by the other, : doubling halves . Such data and situations are often modeled by rational functions.
Some quantities are inversely proportional to the square of a distance. The magnitudes of gravitational force and of electromagnetic force between two objects both follow
so doubling the distance divides the force by 4, and tripling it divides by 9. To build the model, find from one known pair: if when , then .
Quick check · Calculate
No calculator. The intensity of light from a bulb is inversely proportional to the square of the distance from it. A meter 1 meter away reads 36 units. What does it read 3 meters away?
Part 3 Watch it done
How high is the fountain's nozzle?
Watch each step, then do the last one yourself.
A fountain's arc of water reaches its highest point, 3 meters, at 2 meters out from the nozzle, and lands 5 meters out. The nozzle is above the ground. Build a model and find the nozzle's height.
Step 1 · Choose the parent and transform it
One symmetric maximum suggests a quadratic. With vertex : , where is meters out from the nozzle and is meters above the ground.
Step 2 · Use the restriction
The water lands at : , so . The model is for .
Why this step?
Why is the nozzle, and not where the water lands?
The model measures as distance out from the nozzle, so the nozzle itself is at . The domain starts there and ends where the water reaches the ground, at .
Your step · Calculate
No calculator. Finish it. How high is the nozzle, in meters? Give an exact fraction or a decimal to three places.
meters
Part 4 Try it
A regression to predict visitors
A museum counts weekly visitors, in hundreds, weeks after a new exhibit opens: 5.0, 16.2, 25.8, 33.8 and 40.2 for to 4. The first differences, 11.2, 9.6, 8.0 and 6.4, fall by 1.6 each week, so a quadratic regression is the right one to run.
| (weeks) | |
|---|---|
| 0 | 5.0 |
| 1 | 16.2 |
| 2 | 25.8 |
| 3 | 33.8 |
| 4 | 40.2 |
Try it · Calculate
Graphing calculator required. A museum counts weekly visitors, in hundreds, weeks after a new exhibit opens: 5.0, 16.2, 25.8, 33.8 and 40.2 for . Run a quadratic regression on these data, and use it to predict the number of visitors, in hundreds, in week 6.
Part 5 Explain it
Write it the way the exam asks
Nothing you type leaves this page.
Free response is 37.5% of the exam score. This one is shaped like Question 2, Modeling a Non-Periodic Context.
Free-response practice · Question 2 style
Graphing calculator required. The brightness of a streetlight on the ground, in lux, is inversely proportional to the square of the distance in meters from the bulb. At 2 meters the brightness is 180 lux. Build a model for . Then find the average rate of change of from to , with units, and interpret it in context.
Model answer
Inverse square: . From , , so . Then lux. The average rate of change from 2 to 6 meters is lux per meter. On average, the brightness drops 40 lux for each meter farther from the bulb between 2 and 6 meters, though it drops faster near the bulb than farther away.
Score your own answer. This is a self-check, not a grade. Tick each point your answer makes.
Part 6 Check yourself
Filling a tank
The two case questions use the same data. Answer them from the table.
A water tank is filled from a hose. After 10 minutes the flow is turned down. is the volume of water in liters, minutes after the hose is turned on.
| (minutes) | (liters) |
|---|---|
| 0 | 0 |
| 5 | 150 |
| 10 | 300 |
| 15 | 350 |
| 20 | 400 |
| 25 | 450 |
Case question 1 · Multiple choice
No calculator. A piecewise model starts with for . Which second piece, for , fits the table?
Case question 2 · Calculate
No calculator. What is the average rate of change of from to , in liters per minute?
The rest stand on their own and do not use the case.
Check yourself · Sort it
No calculator. Tap a situation, then the model you would build.
Rational
Quadratic
Linear
Check yourself · Spot the error
No calculator. A student uses the gravity model , with in newtons and in meters, to find the average rate of change from to . Tap the first line with a mistake.
Part 7 Keep it
Bring back earlier ideas
Pulling an older idea back up is what makes it last.
From 1.13 Function Model Selection and Assumption Articulation · Fill the statement
No calculator. Tap a blank, then tap a number.
Through any 4 points with distinct inputs there is a polynomial of degree or less, and through any 7 such points there is one of degree or less.
From 1.11 Equivalent Representations of Polynomial and Rational Expressions · Decide and justify
No calculator. A theater's ticket revenue, in hundreds of dollars, at a price of dollars is . Two equivalent forms are the factored form, , and the vertex form, . The manager asks what price gives the most revenue. Which form answers that directly?
Which reason supports your answer?
In three lines
- Build a model from restrictions and transformations of a parent function, or from a regression chosen by the pattern in the data.
- Piecewise models combine techniques on intervals; inversely proportional quantities suggest a rational model such as .
- Use the model for values, rates and average rates, always with units from the context.
Vocabulary
- Function model
- A function built to describe a data set or a situation and to answer questions about it.
- Regression
- A model built with technology that comes as close as possible to a data set, such as a linear, quadratic, cubic or quartic regression.
- Inversely proportional
- Related by , so that doubling one quantity halves the other.
- Inverse square
- A relationship , such as gravitational and electromagnetic force against distance.
- Units of a rate
- Output units per input unit, such as liters per minute or lux per meter.
Course alignment, for teachers
AP Precalculus topic 1.14, Unit 1: Polynomial and Rational Functions.
- Skill 1.C: Construct new functions, using transformations, compositions, inverses, or regressions, that may be useful in modeling contexts, criteria, or data, with and without technology.
- Skill 3.B: Apply numerical results in a given mathematical or applied context.
This lesson maps all 6 essential knowledge statements of the topic to the part that teaches each one: 6 are checked by a scored question. The map is in the lesson file.