Unit 1 · Topic 1.3 · about 30 minutes · 7 parts · 12 scored checks, 2 of them multiple choice
Rates of Change in Linear and Quadratic Functions
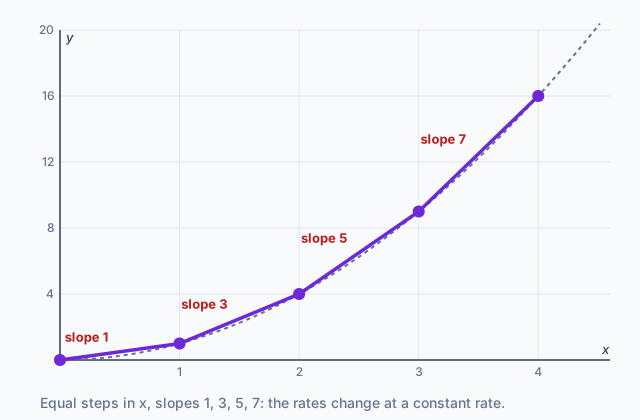 Tap to open the picture full size
Part 1 Think first
Twice as fast, how far to stop?
Guess before you learn. A wrong guess still makes the answer stick.
Predict first
On a dry road, a car going 30 miles per hour needs about 75 feet to stop. About how far does the same car need at 60 miles per hour?
In short. Over equal-length input steps, a linear function's average rates of change stay the same, while a quadratic function's average rates of change change by the same amount each step.
- The average rate of change of from to is the slope of the secant line through and .
- Linear: the average rates over consecutive equal-length intervals are constant, so they change at a rate of zero. Quadratic: they form a linear pattern, so they change at a constant rate.
- When those average rates are increasing, the graph is concave up; when they are decreasing, it is concave down.
Part 2 Learn it
Four short ideas, each checked as you go
2a. An average rate of change is a slope
The average rate of change of over the closed interval is
which is exactly the slope of the line through the two points and on the graph. A line through two points of a graph is called a secant line.
So every average rate of change has a picture. A steep secant line means the output changed a lot for the change in input; a secant line sloping down means the average rate is negative. The diagram at the top of this lesson shows four secant lines on the graph of .
Quick check · Calculate
No calculator. Let . What is the slope of the secant line through and ?
2b. Linear functions: one constant rate
For a linear function, the average rate of change over any interval, of any length, is the same number: the slope of the line.
Take a taxi that charges 3 dollars plus 2 dollars per mile, . Over miles 0 to 1, 1 to 2, 2 to 3 and so on, the average rates are 2, 2, 2: always 2 dollars per mile.
Think of those average rates as a list of their own. For a linear function the list is constant, so the average rates themselves are changing at a rate of zero.
Quick check · Fill the statement
No calculator. Tap a blank, then tap a word.
For a linear function, the average rates of change over consecutive equal-length intervals are , so those average rates are changing at a rate of .
2c. Quadratic functions: rates that change at a constant rate
Now take at . The outputs are 0, 1, 4, 9, 16, and the average rates over the consecutive intervals of length 1 are 1, 3, 5, 7.
Those rates are not constant, but they go up by the same amount, 2, every step. They follow a linear pattern. That is true of every quadratic function: over consecutive equal-length intervals, its average rates of change can be given by a linear function, so they are changing at a constant rate.
The same test works on a sequence, a list of outputs at equally spaced inputs. Find the differences between consecutive terms. If they are constant, the pattern is linear. If the differences of those differences are constant and not zero, it is quadratic.
Quick check · Calculate
No calculator. A quadratic function has average rates of change 5, 2 and over the intervals , and . What is its average rate of change over ?
2d. Concavity from the rates
In 1.1, concave up meant the rate of change was increasing. Now you can test it with numbers.
- If the average rates over equal-length intervals keep increasing for all small intervals, the graph is concave up.
- If they keep decreasing, the graph is concave down.
For the rates 1, 3, 5, 7 increase, so the graph is concave up. Watch the signs: the rates , , are negative but increasing, so that graph is falling and concave up.
Quick check · Sort it
No calculator. Each list gives a function's average rates of change over consecutive intervals of equal length, left to right. Tap a list, then tap the shape of the graph.
Concave up
Concave down
Part 3 Watch it done
Stopping distance, ten miles per hour at a time
Watch each step, then do the last one yourself.
A driving safety guide gives a car's stopping distance , in feet, at speed miles per hour:
, , , , .
Decide what kind of function fits the table, and use it to estimate .
Step 1 · Average rates
Over each 10 mile per hour step: , then 4.5, 5.5 and 6.5 feet per mile per hour.
Step 2 · How the rates change
The rates go up by exactly 1 each step. Average rates over equal intervals that change at a constant rate are the mark of a quadratic function. They are increasing, so the graph is concave up.
Why this step?
Why can a linear model not fit this table?
A linear function has the same average rate of change over every interval. Here the rates are 3.5, 4.5, 5.5 and 6.5, so no single slope gives all of them.
Your step · Calculate
No calculator. Finish it. Estimate the stopping distance at 70 miles per hour, in feet.
feet
Part 4 Try it
Linear, quadratic or neither?
Try it · Match
No calculator. Each list gives the outputs of a function at . Tap a list, then the kind of function it could come from.
Part 5 Explain it
Write it the way the exam asks
Nothing you type leaves this page.
Free response is 37.5% of the exam score. This one is shaped like Question 1, Function Concepts.
Free-response practice · Question 1 style
Graphing calculator required. A function has , , , and . Explain whether these values are consistent with a linear function or a quadratic function, and say whether the graph of is concave up or concave down, using average rates of change.
Model answer
The average rates of change over , , and are 2, 4, 6 and 8. They are not constant, so the values are not consistent with a linear function. They increase by 2 over each consecutive interval of length 2, a constant rate, which is consistent with a quadratic function. Because the average rates are increasing, the graph of is concave up.
Score your own answer. This is a self-check, not a grade. Tick each point your answer makes.
Part 6 Check yourself
A growing tile pattern
The two case questions use the same data. Answer them from the table.
An artist builds a pattern of figures from square tiles. is the number of tiles in figure .
| Figure | Tiles |
|---|---|
| 1 | 2 |
| 2 | 6 |
| 3 | 12 |
| 4 | 20 |
| 5 | 30 |
Case question 1 · Calculate
No calculator. What is the average rate of change of from to , in tiles per figure?
Case question 2 · Multiple choice
No calculator. Which statement describes the average rates of change of over consecutive intervals of length 1?
The rest stand on their own and do not use the case.
Check yourself · Spot the error
No calculator. A student tests whether is linear, where , , and . Tap the line with the mistake.
Check yourself · Decide and justify
No calculator. A seedling's average rates of growth over weeks 0 to 2, 2 to 4 and 4 to 6 are 3.0, 2.2 and 1.4 centimeters per week. What shape is the graph of its height?
Which reason supports your answer?
Part 7 Keep it
Bring back earlier ideas
Pulling an older idea back up is what makes it last.
From 1.2 Rates of Change · Calculate
No calculator. For the falling stone, , and , in meters. Use the interval from to to estimate the rate of change of at , in meters per second.
From 1.1 Change in Tandem · Multiple choice
No calculator. A function has , , , and . Between these inputs its graph is made of straight segments. On which interval is decreasing?
In three lines
- The average rate of change over is the slope of the secant line through and .
- Over consecutive equal intervals, linear rates are constant; quadratic rates change by the same amount each step.
- Increasing average rates mean concave up; decreasing average rates mean concave down.
Vocabulary
- Secant line
- A line through two points on the graph of a function. Its slope is the average rate of change between them.
- Linear function
- A function whose average rate of change is the same over every interval.
- Quadratic function
- A function whose average rates of change over consecutive equal-length intervals change at a constant rate.
- Sequence
- A list of output values, often at equally spaced inputs, whose differences can be studied like average rates of change.
- Concave up
- The average rates of change over equal-length intervals are increasing.
- Concave down
- The average rates of change over equal-length intervals are decreasing.
Course alignment, for teachers
AP Precalculus topic 1.3, Unit 1: Polynomial and Rational Functions.
- Skill 3.B: Apply numerical results in a given mathematical or applied context.
- Skill 3.C: Support conclusions or choices with a logical rationale or appropriate data.
This lesson maps all 6 essential knowledge statements of the topic to the part that teaches each one: 6 are checked by a scored question. The map is in the lesson file.