Unit 2 · Topic 2.14 · about 30 minutes · 7 parts · 15 scored checks, 1 of them multiple choice
Logarithmic Function Context and Data Modeling
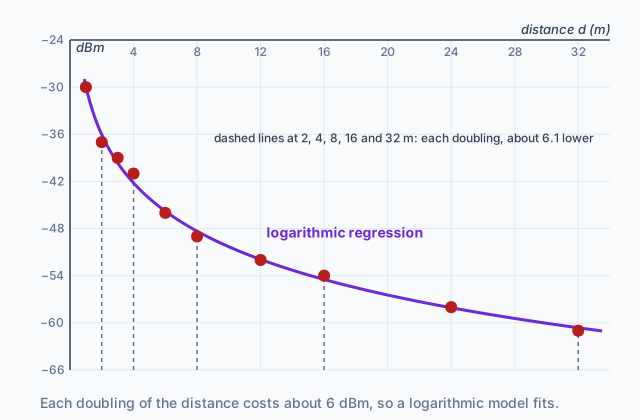 Tap to open the picture full size
Part 1 Think first
Where does the signal drop again?
Guess before you learn. A wrong guess still makes the answer stick.
Predict first
Your phone's Wi-Fi app shows signal strength in dBm. The number is negative, and the closer it is to 0, the stronger the signal. Standing 2 meters from the router, it reads . At 4 meters it reads . You keep walking down the hall. At about what distance would you expect it to read ?
In short. A logarithmic function model fits a situation where the input is multiplied by the same factor for each equal step in the output, and you build one from a proportion and a real zero, from two input-output pairs, by transforming , or with a logarithmic regression.
- A logarithmic function is the inverse of an exponential one, so a whole-number output counts how many times the initial value was multiplied by the proportion.
- A logarithmic regression (LnReg on a graphing calculator) fits with the natural logarithm, and needs every input to be positive.
- The model predicts an output when you substitute an input, and gives an input when you set it equal to a value and undo by raising to both sides.
Part 2 Learn it
Four short ideas, each checked as you go
2a. Inputs that multiply, outputs that step
A logarithmic function is the inverse of an exponential function, so it answers the backward version of a growth question. A culture starts with 200 cells and doubles every generation, so after generations it has cells. Turn that around and ask how many generations it takes to reach cells. The answer is .
| Cells | Generations |
|---|---|
| 200 | 0 |
| 400 | 1 |
| 800 | 2 |
| 1,600 | 3 |
| 3,200 | 4 |
Read the table down. Each input is 2 times the one before, while each output is 1 more. That is the pattern to look for in data: inputs that change proportionally over equal-length output intervals. When you see it, a logarithmic model is a good candidate.
A whole-number output has a plain meaning. says the starting 200 was multiplied by 2 three times to reach 1,600. The output counts the multiplications.
The Wi-Fi readings in Think first have the same shape. The distances 2, 4 and 8 meters multiply by 2, and the readings drop by 6 each time.
Quick check · Fill the statement
No calculator. A culture starts with 300 cells and triples every generation, so after generations it has cells. Tap a blank, then tap an answer.
The model gives , the number of times 300 was multiplied by 3. Each step of 1 in goes with a cell count the one before, and is the of the function .
2b. From a proportion and a zero, or from two points
A logarithmic model can be built from either of two kinds of information.
A proportion and a real zero. The proportion is the factor the input is multiplied by for each step of 1 in the output. The real zero is the input where the output is 0. For the culture, the proportion is 2 and the zero is at , since it takes no generations to have the 200 cells you started with. A base 2 logarithm that equals 0 at 200 is .
Two input-output pairs. Say the phone reads at 2 meters and at 8 meters. The distances that matter are doublings, so use . Since and , the two pairs give
Subtract the first from the second: , so and . The model is . Check it on the reading you did not use: , which matches.
Quick check · Calculate
No calculator. A nature reserve counts bird species in survey plots of different sizes. A model , with the plot area in hectares, gives 10 species for a 3-hectare plot and 18 species for a 27-hectare plot. How many species does the model predict for a 243-hectare plot?
2c. Shaping to fit the context
The plain model is 0 at , and its output changes by each time is multiplied by . A context rarely lines up with that, so you transform it to match what the context tells you.
| What the context says | Transformation | Model |
|---|---|---|
| The output is 0 at | None | |
| The output is 0 at | Horizontal dilation: divide by 8 | |
| The output is 20 at | Vertical translation: add 20 | |
| The input starts at 0, where a logarithm is not defined | Horizontal translation: use | |
| The output falls 5 each time doubles | Reflection: make negative |
Check a row before trusting it. In , putting in gives , and doubling adds 5.
One more thing about the base. The natural logarithm, with base , is often useful in modeling real data. Any base can be rewritten that way, since , so the choice of base changes how a model looks, not what it predicts.
Quick check · Match
No calculator. Each description gives a feature of a context. Tap a description, then the model that fits it.
2d. Logarithmic regression, then predicting and solving
Real data never land exactly on a curve, so you let technology fit one. On a graphing calculator, enter the inputs and outputs as two lists and run a logarithmic regression, LnReg. It returns , using the natural logarithm. It needs every input to be positive, because is not defined for .
Then the model does two jobs. Suppose LnReg gives .
- Predict an output. At , .
- Find an input. For , subtract and divide to get , then raise to both sides: .
The last step undoes , so it uses , not 10. Keep the calculator's full values while you work and round at the end. And when an input is far outside the data, the answer assumes the pattern keeps going, so say that when you use it.
Quick check · Decide and justify
No calculator. A logarithmic regression on a data set gives . Which expression gives the input at which the model's output is 25?
Which reason supports your answer?
Part 3 Watch it done
A game's levels from two data points
Watch each step, then do the last one yourself.
In a phone game, the level goes up by the same amount each time a player's total points double. A player is level 12 at 1,000 points and level 20 at 16,000 points. Write a model for the level at points, find the level at 64,000 points, and find the points needed for level 30.
Step 1 · Find the proportion
16,000 is 1,000 multiplied by 16, and , so that is four doublings. Over those four doublings the level went from 12 to 20, up 8. So each doubling of the points adds 2 levels.
Step 2 · Transform $a\log_b x$ to match
Start from , which rises 2 every time doubles. Divide by 1,000 inside the logarithm so it is 0 at , then add 12 so the level there is 12: . Check the other pair: .
Why this step?
Why divide by 1,000 inside the logarithm?
Because . Dividing by 1,000 makes the logarithm 0 exactly at , so the level there is the 12 that was added on. Without it, is about 31.9, not 12.
Step 3 · Predict an output
At 64,000 points, , so .
Your step · Calculate
No calculator. Finish it. How many points does the model say a player needs to reach level 30?
points
Part 4 Try it
Fit a typing practice curve
A student practices typing and records their speed, in words per minute, after 1 to 12 weeks of practice (invented data): 19, 27, 33, 37, 42, 44, 45, 46, 50, 50, 52 and 52. Early weeks bring big gains and later weeks small ones. The lab below opens on these data with the logarithmic model selected, which is the same fit a calculator's LnReg gives. Read the model it prints, type 16 into the prediction box, then find the week where the model reaches 48 words per minute.
Try it · Calculate
Graphing calculator required. A student's typing speed, in words per minute, is 19, 27, 33, 37, 42, 44, 45, 46, 50, 50, 52 and 52 after 1 to 12 weeks of practice. Run a logarithmic regression on these data. What typing speed does the model predict after 16 weeks? Give your answer to one decimal place.
Try it · Calculate
Graphing calculator required. A student's typing speed, in words per minute, is 19, 27, 33, 37, 42, 44, 45, 46, 50, 50, 52 and 52 after 1 to 12 weeks of practice. Run a logarithmic regression on these data. After how many weeks does the model predict a speed of 48 words per minute? Give your answer to one decimal place.
Part 5 Explain it
Write it the way the exam asks
Nothing you type leaves this page.
Free response is 37.5% of the exam score. This one is shaped like Question 2, Modeling a Non-Periodic Context.
Free-response practice · Question 2 style
Graphing calculator required. A programmer times how long a search takes on sorted lists of different sizes. For list sizes of 1, 2, 4, 8, 16, 32 and 64 thousand items, the average search times are 1.2, 1.5, 1.9, 2.24, 2.52, 2.83 and 3.19 microseconds (invented data). (A) Using values from the data, explain why a logarithmic function model is appropriate. (B) Use a logarithmic regression to find a model , with in thousands of items. (C) Use the model to predict the search time for a list of 100 thousand items. (D) Use the model to find the list size for which the model predicts a search time of 4 microseconds.
Model answer
(A) Each time the list size doubles, the time goes up by about the same amount: 0.30, 0.40, 0.34, 0.28, 0.31 and 0.36 microseconds. Inputs that change proportionally over roughly equal output steps are the pattern of a logarithmic function. (B) . (C) microseconds, using the calculator's unrounded values. (D) Set , so and, keeping the unrounded values, . The model predicts 4 microseconds for a list of about 351 thousand items. Both (C) and (D) go past the 64 thousand items in the data, so they assume the pattern continues.
Score your own answer. This is a self-check, not a grade. Tick each point your answer makes.
Part 6 Check yourself
Signal down a hallway
The three case questions use the same table. Answer them from it.
A student walks down a long school hallway with a phone and records the Wi-Fi signal strength at several distances from the router. Signal strength is measured in dBm: the readings are negative, and a reading closer to 0 is a stronger signal. A logarithmic regression of signal strength against distance is called .
| (meters) | Signal (dBm) |
|---|---|
| 1 | |
| 2 | |
| 3 | |
| 4 | |
| 6 | |
| 8 | |
| 12 | |
| 16 | |
| 24 | |
| 32 |
Case question 1 · Multiple choice
No calculator. Which feature of the Wi-Fi table best supports using a logarithmic model for signal strength against distance?
Case question 2 · Calculate
Graphing calculator required. Use a logarithmic regression on the Wi-Fi table, with the distance in meters and the signal strength in dBm. What signal strength does the model predict at 20 meters? Give your answer to one decimal place.
Case question 3 · Calculate
Graphing calculator required. Use a logarithmic regression on the Wi-Fi table, with the distance in meters and the signal strength in dBm. At what distance does the model predict a signal strength of dBm? Give your answer to the nearest tenth of a meter.
The rest stand on their own and do not use the case.
Check yourself · Spot the error
No calculator. A student builds a model for the number of rounds a knockout tournament needs for teams, where each round knocks out half of the teams still playing. Tap the first line with a mistake.
Check yourself · Sort it
No calculator. Tap a card, then the bin it belongs in.
A logarithmic model fits
Not a logarithmic pattern
Check yourself · Put it in order
No calculator. A student has a data table and needs the input at which a logarithmic regression model reaches an output of 70. Put the steps in order.
Part 7 Keep it
Bring back earlier ideas
Pulling an older idea back up is what makes it last.
A keypad lock uses a code of digits, each from 0 to 9. It has possible codes, so a 4-digit lock has 10,000 of them. A lock maker works the other way round. She starts from how many possible codes she wants and needs the number of digits that gives exactly that many. That is a question for the inverse of .
From 2.10 Inverses of Exponential Functions · Decide and justify
No calculator. Which function takes a number of possible codes and returns the number of digits that gives exactly that many codes?
Which reason supports your answer?
From 2.6 Competing Function Model Validation · Spot the error
No calculator. A food truck's model predicts 132 lunches on Friday, and the truck sells 120. A student works out what the residual says. Tap the first line with a mistake.
In three lines
- A logarithmic model fits when the inputs multiply over equal output steps; a whole-number output counts the multiplications.
- Build it from a proportion and a real zero, from two input-output pairs, by transforming , or by LnReg, which fits .
- Substitute to predict an output; to find an input, isolate and raise to both sides.
Vocabulary
- Logarithmic function model
- A function such as , or a transformation of it, used to describe a situation where the inputs change proportionally over equal-length output intervals.
- Proportion
- The factor the input is multiplied by for each equal step in the output of a logarithmic model, such as 2 when every doubling adds the same amount.
- Real zero
- An input where the model's output is 0, which together with a proportion is enough to build a logarithmic model.
- Logarithmic regression
- A fit by technology, such as LnReg on a graphing calculator, of a model to a data set whose inputs are all positive.
- Natural logarithm
- The logarithm with base , written , the base a logarithmic regression uses and the inverse of .
Course alignment, for teachers
AP Precalculus topic 2.14, Unit 2: Exponential and Logarithmic Functions.
- Skill 1.C: Construct new functions, using transformations, compositions, inverses, or regressions, that may be useful in modeling contexts, criteria, or data, with and without technology.
- Skill 3.B: Apply numerical results in a given mathematical or applied context.
This lesson maps all 6 essential knowledge statements of the topic to the part that teaches each one: 6 are checked by a scored question. The map is in the lesson file.