Unit 2 · Topic 2.3 · about 30 minutes · 7 parts · 13 scored checks, 2 of them multiple choice
Exponential Functions
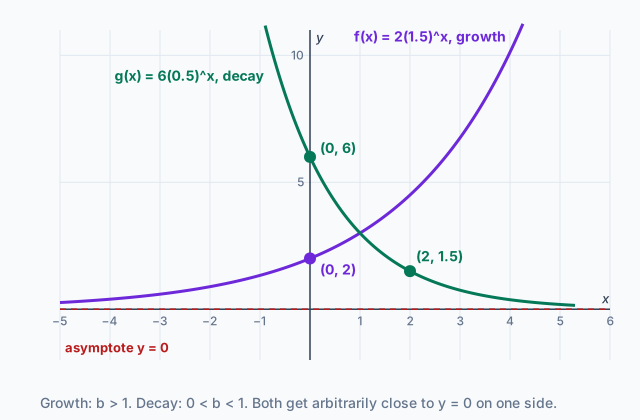 Tap to open the picture full size
Part 1 Think first
Half of what is left
Guess before you learn. A wrong guess still makes the answer stick.
Predict first
A patient takes a 400 milligram dose of a medicine. A simple model says the amount in the body halves every 6 hours. According to this model, about how much is left 2 days after the dose?
In short. An exponential function in general form, , starts at the initial value and is multiplied by the base for every unit step in the input.
- With , a base gives exponential growth and a base gives exponential decay. The domain is all real numbers.
- Outputs are proportional over equal-length input-value intervals, so the graph is always increasing or always decreasing and always concave up or always concave down, with no points of inflection and no extrema except on a closed interval.
- As the input increases or decreases without bound, the outputs increase or decrease without bound or get arbitrarily close to zero.
Part 2 Learn it
Four short ideas, each checked as you go
2a. Initial value and base
The general form of an exponential function is .
- is the initial value, because . It cannot be 0.
- is the base, with and . A base of 1 gives a constant function, and a negative base flips the sign at every step and has no value at .
When , a base is exponential growth, as in . A base is exponential decay, as in . The base decides this, not the initial value: starts small and still grows.
When the input is a natural number, it counts how many factors of the base are applied to the initial value. For , .
The input is not limited to counting numbers, though. The domain is all real numbers. takes one factor away, and is half a step. The graph is one unbroken curve.
Quick check · Sort it
No calculator. Tap a function, then where it belongs.
Exponential growth
Exponential decay
Not an exponential function
2b. One direction, one bend
Step 1 unit to the right and the output of is multiplied by . That is true wherever you start, so the outputs are proportional over equal-length input-value intervals. That one fact fixes the shape.
Take . At the outputs are 2, 3, 4.5 and 6.75. They climb by 1, then 1.5, then 2.25: always going up, and going up faster. So is always increasing and its graph is always concave up. A decay function such as is always decreasing, and its drops shrink, so its graph is concave up too.
A negative reflects the graph over the -axis. Then the graph is concave down, and increasing and decreasing swap.
Because the direction never switches, an exponential function has no extrema, except on a closed interval, where they sit at the endpoints. Because the concavity never switches, its graph has no points of inflection.
Quick check · Multiple choice
No calculator. Let . Which describes the graph of over all real numbers?
2c. What happens at the ends
Follow out to the right. Each step multiplies by 1.5 forever, so the outputs increase without bound:
Go left instead and each step divides by 1.5. The outputs get arbitrarily close to zero without ever reaching it:
So the line is a horizontal asymptote, but on one side only. A decay function approaches it on the right: , while . A negative sends the unbounded end down: .
For the general form, that is the whole list. At each end the outputs go to , to , or to 0.
Quick check · Fill the statement
No calculator. Tap a blank, then tap an answer.
is , and is .
2d. When the outputs are not proportional
Some data look exponential but fail the test. Here , , and . The ratios , and are not equal, so the outputs are not proportional.
Now subtract 3 from every output: 2, 4, 8, 16. Each is twice the one before. The new outputs are proportional, so , and
That is an additive transformation of an exponential function: the graph of moved up 3. It is still always increasing and concave up, but its horizontal asymptote is now .
The context often suggests the constant, such as a room temperature or a fixed fee. A clue in the numbers is the drops or rises themselves: here they are 2, 4 and 8, which are proportional even though the outputs are not.
Quick check · Calculate
No calculator. A function has , , and . These outputs are not proportional, but subtracting the same constant from every output makes them proportional. What is the common ratio of those new outputs?
Part 3 Watch it done
Reading an exponential graph
Watch each step, then do the last one yourself.
The graph of passes through and . Find and , describe the graph, and find .
Step 1 · Read the initial value
, so the -intercept is the initial value: .
Step 2 · Find the base
Going from to applies two factors of : . So and .
Why this step?
Why is and not ?
is also 0.25, but the base of an exponential function must be positive. A negative base flips the sign at every step and has no value at , so the graph would not be one unbroken curve.
Step 3 · Describe it
and , so this is exponential decay: . The graph is always decreasing and always concave up, with no extrema and no point of inflection. and . It is the decay curve in the diagram.
Your step · Calculate
No calculator. Finish it. What is ?
Part 4 Try it
Move the asymptote
Try it · Calculate
No calculator. The lab graphs . Choose the exponential family and set , and , so . What value of makes the graph of pass through the origin? Use the lab to check.
Part 5 Explain it
Write it the way the exam asks
Nothing you type leaves this page.
Free response is 37.5% of the exam score. This one is shaped like Question 1, Function Concepts.
Free-response practice · Question 1 style
Graphing calculator required. The function is given by . (i) Identify whether demonstrates exponential growth or exponential decay, and give a reason. (ii) Describe whether the graph of is increasing or decreasing, and its concavity. (iii) Does have a maximum value over all real numbers? Does it have one on ? Explain your reasoning. (iv) Write .
Model answer
(i) Exponential decay, because the initial value 80 is positive and the base 0.75 is between 0 and 1. (ii) The graph is always decreasing and always concave up, since each step multiplies the output by 0.75 and the drops get smaller. (iii) Over all real numbers there is no maximum: is always decreasing, so any input has a larger output to its left. On the maximum is at the left endpoint, . (iv) .
Score your own answer. This is a self-check, not a grade. Tick each point your answer makes.
Part 6 Check yourself
A cooling cup of tea
The two case questions use the same data. Answer them from the table.
A cup of tea is left on a desk. Its temperature , in degrees Celsius, is measured every 10 minutes.
| Time (minutes) | (degrees Celsius) |
|---|---|
| 0 | 84 |
| 10 | 52 |
| 20 | 36 |
| 30 | 28 |
| 40 | 24 |
Case question 1 · Multiple choice
No calculator. Which statement shows that an additive transformation of an exponential function is a good model for these data?
Case question 2 · Calculate
No calculator. If the pattern continues, what will the temperature be at 50 minutes, in degrees Celsius?
The rest stand on their own and do not use the case.
Check yourself · Match
No calculator. Each description is of the graph of . Tap a description, then the values of and that produce it.
Check yourself · Decide and justify
No calculator. The concentration of a medicine in the blood is modeled by milligrams per liter, hours after a dose, for . Does have a least value on this interval?
Which reason supports your answer?
Check yourself · Spot the error
No calculator. A student describes . Tap the line with the mistake.
Part 7 Keep it
Bring back earlier ideas
Pulling an older idea back up is what makes it last.
From 1.12 Transformations of Functions · Decide and justify
No calculator. The graph of passes through . Which function's graph passes through ?
Which reason supports your answer?
From 1.6 Polynomial Functions and End Behavior · Match
No calculator. Tap a statement in limit notation, then the words that say the same thing.
In three lines
- In , is the initial value and , is the base; with , is growth and is decay.
- Proportional outputs make the graph always increasing or always decreasing and always concave one way, with no inflection points and no extrema except on a closed interval.
- At each end the outputs go to , or 0, and data that become proportional after subtracting a constant fit an additive transformation.
Vocabulary
- Exponential function
- A function of the form , with , and .
- Initial value
- The constant in , which is the output .
- Base
- The constant in , the factor the output is multiplied by for each unit step in the input.
- Exponential growth
- The behavior of when and .
- Exponential decay
- The behavior of when and .
- Additive transformation
- Adding a constant to a function's outputs, as in , which moves its graph and its horizontal asymptote up or down by .
Course alignment, for teachers
AP Precalculus topic 2.3, Unit 2: Exponential and Logarithmic Functions.
- Skill 3.A: Describe the characteristics of a function with varying levels of precision, depending on the function representation and available mathematical tools.
This lesson maps all 5 essential knowledge statements of the topic to the part that teaches each one: 5 are checked by a scored question. The map is in the lesson file.