Unit 2 · Topic 2.5 · about 30 minutes · 7 parts · 14 scored checks, 2 of them multiple choice
Exponential Function Context and Data Modeling
 Tap to open the picture full size
Part 1 Think first
Day 10 for a new video
Guess before you learn. A wrong guess still makes the answer stick.
Predict first
A new video had 1,000 views on its first day and 2,000 on its second. One friend says it will get about 10,000 views on day 10. Another says it will get over 500,000. Who could be right?
In short. An exponential model describes a quantity that is multiplied by the same factor over every equal-length interval of input, and you build it from an initial value and that factor, from two points, or from data with a regression.
- In , is the value at and is the growth factor for each unit of input: a 4% increase is and a 4% decrease is .
- Two input-output pairs give a system you solve for and . If the data level off toward some value, subtract that value first and the constant ratio appears.
- An equivalent form such as shows the factor over a different period, and a prediction only means something inside the domain the context allows.
Part 2 Learn it
Four short ideas, each checked as you go
2a. Equal steps in, equal ratios out
A bike-share program counts its rides each month: 1,000, then 1,200, then 1,440, then 1,728. The differences grow (200, 240, 288), so this is not linear. Divide instead: .
When outputs over equal-length input intervals have a constant ratio, an exponential function models them. With whole-number inputs it is repeated multiplication: start at 1,000 and multiply by 1.2 once per month.
In , is the value at and is the growth factor for each one-unit step. The factor ties to a percent change: 1.2 means each month is 120% of the month before, an increase of 20%. A factor below 1 is decay: keeps 85% and loses 15% each step.
So a 4% increase is , never 0.04 and never 4.
Quick check · Fill the statement
No calculator. A town's population grows by 3% each year. One year after the count began, it had 12,360 people. Tap a blank, then tap an answer.
The model is , with in years, where = and = .
2b. Build it from two points, then use it
Often you know two outputs, not the start. A phone game had 6,000 players in week 1 and 13,500 in week 3. Write both into :
Divide the second equation by the first and cancels: , so . Then , the players in week 0.
With several data points that are close to proportional but not exactly, a graphing calculator runs an exponential regression and gives the and that fit best.
Once you have a model, use it both ways. Put in a week to predict players; set and solve, with a graph or a calculator, to find when the game reaches 30,000 (about week 5). Keep the context's domain in mind. Weeks before launch mean nothing, and no game keeps growing 50% a week forever, so a prediction far past the data deserves doubt.
Quick check · Calculate
No calculator. A jar holds 60 fruit flies on day 2 and 480 on day 5. The count is modeled by . What is , the number of flies on day 0?
2c. Shift first, then look for the ratio
A can of soda comes out of the fridge at 4 degrees Celsius into a 22 degree room. Every 10 minutes it reads 4, 10, 14 and about 16.67 degrees. The ratios and are not equal, so the readings themselves are not exponential.
But the soda is closing a gap. Subtract each reading from 22: the gaps are 18, 12, 8 and 5.33, and each is of the one before. Adding or subtracting a constant can reveal a proportional pattern that the raw data hide.
Build the model as a transformation of :
The 22 is a vertical shift to the room temperature the soda approaches. The minus sign flips the shrinking gap below it. Dividing by 10 makes the factor apply once every 10 minutes. If a context counts years from 2015 rather than from 0, shift horizontally: equals when .
Quick check · Decide and justify
No calculator. Tea is poured at 90 degrees Celsius in a 20 degree room. Every 5 minutes it reads 90, 76, 64.8 and 55.84 degrees. Which model fits, with in minutes?
Which reason supports your answer?
2d. Same function, different clock
A cell culture is modeled by , with in days. The base says the culture grows by a factor of 1.5 each day. An equivalent form answers a different question:
Now the base says the culture multiplies by about 17.09 every week, because counts weeks. For hours, : about 1.70% per hour. Dividing 50% by 24 gives 2.08%, which is wrong, because growth on growth adds up.
Many models use the natural base , about 2.718, written . It is still an exponential with a factor per unit: . For the factor is , a growth of about 5.13% per unit, a little more than 5%.
Quick check · Match
No calculator. Each form below equals , with in days. Use , and . Tap a form, then what its base shows.
Part 3 Watch it done
What is the car worth?
Watch each step, then do the last one yourself.
A used car is worth 20,000 dollars one year after it is bought and 16,000 dollars two years after. Its value , in dollars, years after purchase, is modeled by an exponential function. Build the model and find the car's value four years after purchase.
Step 1 · Find the factor from equal steps
Years 1 and 2 are one year apart, so the factor is the ratio of the values: . The car keeps 80% of its value each year, a 20% drop.
Step 2 · Go back to $t = 0$ for $a$
, so . The model is for .
Why this step?
What does mean, and why is it not the 20,000 from the problem?
The value is , the car's value on the day it was bought, 25,000 dollars. The 20,000 dollars is one year later, after one drop of 20%.
Your step · Calculate
No calculator. Finish it. What is the car worth four years after purchase, in dollars?
dollars
Part 4 Try it
Fit a curve to a medicine's decay
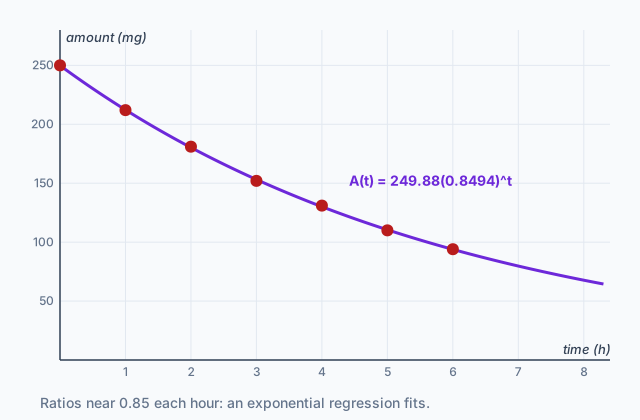
A nurse records the amount of a medicine left in a patient's bloodstream every hour after a dose. The ratios of consecutive readings sit between about 0.84 and 0.87, close to constant but not exactly, which is what real measurements look like. That makes this a job for an exponential regression. Enter the hours and the amounts as two lists and run ExpReg, which reports a model .
| (hours) | (milligrams) |
|---|---|
| 0 | 250 |
| 1 | 212 |
| 2 | 181 |
| 3 | 152 |
| 4 | 131 |
| 5 | 110 |
| 6 | 94 |
Try it · Calculate
Graphing calculator required. The amount of a medicine in the bloodstream, in milligrams, is 250, 212, 181, 152, 131, 110 and 94 at hours. Run an exponential regression on these data. By what percent does the amount decrease each hour, according to the model? Round only at the end, and give a percent to one decimal place.
Try it · Calculate
Graphing calculator required. An exponential regression on medicine data (250, 212, 181, 152, 131, 110 and 94 milligrams at to 6 hours) gives . After how many hours does the model first give 50 milligrams? Give your answer to the nearest tenth of an hour.
Part 5 Explain it
Write it the way the exam asks
Nothing you type leaves this page.
Free response is 37.5% of the exam score. This one is shaped like Question 2, Modeling a Non-Periodic Context.
Free-response practice · Question 2 style
Graphing calculator required. A streaming service had 4.0 million subscribers at and 6.25 million at , where is years since 2020. The number of subscribers, in millions, is modeled by . (a) Find and . (b) Interpret as a percent change in context. (c) Rewrite in a form that shows the growth factor per month, and explain why the monthly percent is not one twelfth of the yearly percent. (d) Use the model to predict the subscribers in 2025.
Model answer
(a) and , so and . Then , so . (b) Each year the subscribers are 1.25 times the year before, an increase of 25% per year. (c) , about 1.88% per month. One twelfth of 25% is about 2.08%, but each month grows on the larger total from the month before, so a smaller monthly percent compounds to 25% over 12 months. (d) 2025 is : million subscribers.
Score your own answer. This is a self-check, not a grade. Tick each point your answer makes.
Part 6 Check yourself
Algae on a pond
The three case questions use the same data. Answer them from the table.
A science class measures the area of a pond covered by algae, in square meters, weeks after they first notice it. The whole pond has a surface of 400 square meters.
| (weeks) | (square meters) |
|---|---|
| 0 | 12 |
| 1 | 18 |
| 2 | 27 |
| 3 | 40.5 |
| 4 | 60.75 |
Case question 1 · Multiple choice
No calculator. Which statement describes how the area covered by algae changes from week to week?
Case question 2 · Calculate
No calculator. The class models the data with . The model can only hold while the algae fits on the pond. What is the last whole week for which the model gives an area of no more than 400 square meters?
Case question 3 · Multiple choice
No calculator. The area is with in weeks. Which expression gives the same area with the input in days?
The rest stand on their own and do not use the case.
Check yourself · Sort it
No calculator. Each statement describes a yearly change in a model . Tap a statement, then the base it gives.
b = 1.04
b = 0.96
b = 1.4
Check yourself · Spot the error
No calculator. A bacteria culture is modeled by , with in hours. A student finds the percent change per hour. Tap the first line with a mistake.
Part 7 Keep it
Bring back earlier ideas
Pulling an older idea back up is what makes it last.
A museum counts weekly visitors, in hundreds, weeks after a new exhibit opens: 5.0, 16.2, 25.8, 33.8 and 40.2 for to 4. The first differences, 11.2, 9.6, 8.0 and 6.4, fall by 1.6 each week, so a quadratic regression is the right one to run.
| (weeks) | |
|---|---|
| 0 | 5.0 |
| 1 | 16.2 |
| 2 | 25.8 |
| 3 | 33.8 |
| 4 | 40.2 |
From 1.14 Function Model Construction and Application · Calculate
Graphing calculator required. A museum counts weekly visitors, in hundreds, weeks after a new exhibit opens: 5.0, 16.2, 25.8, 33.8 and 40.2 for . Run a quadratic regression on these data, and use it to predict the number of visitors, in hundreds, in week 6.
From 1.13 Function Model Selection and Assumption Articulation · Match
No calculator. Tap a situation, then the model type it suggests.
In three lines
- Constant ratios over equal input steps mean exponential: with and growth factor , so 4% more is 1.04.
- Build the model from a factor and a start, from two points by dividing one equation by the other, from shifted data, or with an exponential regression.
- Rewrite the exponent to show the factor for another period, and use the model only where the context makes sense.
Vocabulary
- Exponential model
- A function , or a transformation of one, used for a quantity whose outputs over equal-length input intervals are proportional.
- Initial value
- The value in , which is the output at .
- Growth factor
- The base in , the number the output is multiplied by for each one-unit increase in the input.
- Percent change
- The change a growth factor stands for in context: is a 4% increase per unit and is a 4% decrease.
- Exponential regression
- A model that technology fits as closely as possible to a data set.
- Natural base
- The number , often used as the base of exponential models written .
Course alignment, for teachers
AP Precalculus topic 2.5, Unit 2: Exponential and Logarithmic Functions.
- Skill 1.C: Construct new functions, using transformations, compositions, inverses, or regressions, that may be useful in modeling contexts, criteria, or data, with and without technology.
- Skill 3.B: Apply numerical results in a given mathematical or applied context.
This lesson maps all 9 essential knowledge statements of the topic to the part that teaches each one: 9 are checked by a scored question. The map is in the lesson file.