Unit 2 · Topic 2.6 · about 30 minutes · 7 parts · 14 scored checks, 3 of them multiple choice
Competing Function Model Validation
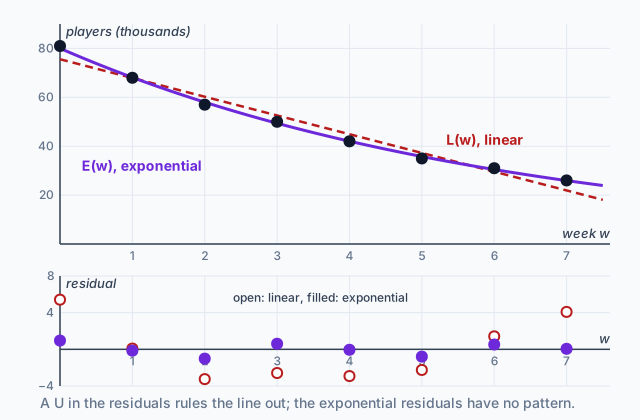 Tap to open the picture full size
Part 1 Think first
Which forecast would you plan around?
Guess before you learn. A wrong guess still makes the answer stick.
Predict first
A new phone game had 81 thousand daily players in its launch week, and fewer every week after, down to 26 thousand in week 7. The studio has no updates or advertising planned. An analyst fits three models to those eight weeks. Every one of them comes within 6 thousand players of every week. For week 20 they forecast about thousand, about 100 thousand and about 3 thousand players. Which forecast would you plan the game's servers around?
In short. When several models fit the same data closely, you validate them: a model is appropriate when its residual plot shows no pattern, and the context decides between models that pass.
- A residual is the actual value minus the value the model predicts. A positive residual means the model underestimates there, and a negative one means it overestimates.
- A residual plot puts the input on the horizontal axis and the residuals on the vertical axis. A shape in it, such as a U, means the model misses structure in the data.
- Context settles the rest: a count cannot go negative, a quantity with no reason to turn around should not, and some situations make one direction of error safer than the other.
Part 2 Learn it
Four short ideas, each checked as you go
2a. Three models can fit the same data
Here is the game's data, in thousands of daily players, weeks after launch.
| (weeks) | 0 | 1 | 2 | 3 | 4 | 5 | 6 | 7 |
|---|---|---|---|---|---|---|---|---|
| (thousands) | 81 | 68 | 57 | 50 | 42 | 35 | 31 | 26 |
The weekly drops are 13, 11, 7, 8, 7, 4 and 5 thousand. They are not constant, so no line goes through every point, but they change only a little from week to week. Data whose rate of change changes slightly like this can be modeled by a linear, a quadratic or an exponential function. A graphing calculator's three regressions give
All three stay close to the data. The line is never more than about 5.4 thousand players off, and the other two never more than about 1.3 thousand.
They disagree about how the game loses players, though. The line loses the same number every week, its slope. The quadratic's weekly loss shrinks by the same amount each week, which is for a quadratic . The exponential keeps the same share of its players every week, its base. Those different stories are what you will test.
Quick check · Match
No calculator. All three models fit the game data closely. Tap a model, then what it says happens to the players week by week.
2b. Residuals, and what their plot shows
A residual is the actual value minus the value the model predicts.
In launch week the line predicts thousand players, and 81 thousand actually played. The residual is . It is positive, so the real point sits above the model. A negative residual means the point sits below it.
A residual plot puts the input on the horizontal axis and the residuals on the vertical axis. A model is justified as appropriate when its residual plot appears without pattern: the points fall above and below zero with no shape to them.
In week order, the signs of the line's residuals are . Positive at both ends and negative in the middle is a U shape. The data bend and the line cannot, so it misses the same way in the same places. That pattern rules the line out, small residuals or not.
The residuals of have signs and those of have signs , every one under 1.3 in size. Neither plot has a shape, so both pass.
Quick check · Sort it
No calculator. Each list gives the signs of a model's residuals, in order of the input. Tap a list, then say what its residual plot shows.
A pattern: the model is not appropriate
No pattern: the model is appropriate
2c. Let the context choose
Both and pass the residual check. To choose, ask what each model says outside the eight weeks and whether that makes sense for a game.
is a parabola that opens up, with its vertex at . After week 9 it says players come back, with no update and no advertising. By week 20 it predicts thousand, more than launch week.
The line is worse. , a negative number of players.
keeps falling and never reaches zero. It says the game keeps about 85% of its players each week, so the players who leave are a share of the players still there. That is how people drift away from a game nobody is updating, and it makes the model to use for weeks past the data.
So compare models on two things: the residuals, and whether the model's behavior fits what you know about the situation. A count that cannot go negative, or a quantity with no reason to turn around, is a clue the data alone cannot give you.
Quick check · Decide and justify
No calculator. A lab measures the caffeine in a volunteer's blood every hour for 6 hours after one cup of coffee. A quadratic model and an exponential model both have residual plots with no pattern. The quadratic opens up, with its vertex at 9 hours. Which model should the lab use to estimate the caffeine 12 hours after the coffee?
Which reason supports your answer?
2d. Over, under, and which is worse
You can read a model's error at an input two ways. The signed residual says which way the model missed. Its absolute value says by how much.
A negative residual means the actual value is below the prediction, so the model overestimates there. A positive residual means the model underestimates. A run of residuals with one sign shows the model overestimating or underestimating on a whole interval. The line for the game overestimates from week 2 to week 5, by 2.25 to 3.25 thousand players, and underestimates at both ends.
Which error is worse depends on the situation. The game studio rents servers from its forecast. Too low a forecast and the servers overload, so players cannot log in. Too high and the studio pays for some empty space. For the studio, a model that overestimates a little is preferred to one that underestimates. A store ordering fresh milk that spoils in a week sees it the other way round: too high a forecast means milk poured down the drain.
Quick check · Fill the statement
No calculator. A phone shows how many minutes of battery are left, from a model of how the phone has been used. One afternoon its residuals were , and minutes. Tap a blank, then a word.
The residuals are negative, so the model's predictions the time left. A phone that shuts off sooner than it said is worse than one with time to spare, so the safer error for this model is to .
Part 3 Watch it done
Validate the exponential model
Watch each step, then do the last one yourself.
The studio wants to forecast with , where is thousands of daily players weeks after launch. The actual counts for weeks 0 to 7 are 81, 68, 57, 50, 42, 35, 31 and 26 thousand. Find the residuals, decide whether is appropriate, and say whether it overestimates or underestimates in week 5.
Step 1 · Predict each week
Evaluate the regression stored in the calculator at to 7: 80.04, 68.14, 58.01, 49.39, 42.05, 35.80, 30.47 and 25.94 thousand players. Use the stored model, not the rounded typed back in: its predictions drift by about 70 players by week 7.
Step 2 · Subtract, actual minus predicted
Week 0: . Week 1: . Week 2: . Week 3: . Week 4: . Weeks 6 and 7 give and .
Why this step?
Why find every residual instead of only the biggest one?
Appropriateness is about the shape of the whole residual plot. One big residual says how far off the model is at one input. Only the full set of signs, in order, can show a U or a trend.
Your step · Calculate
No calculator. Finish it. In week 5 the game had 35 thousand players and . What is the residual for week 5, in thousands of players?
thousand players
Part 4 Try it
Price an old car
A dealer has the value of one car model at ages 0 to 10 years, in thousands of dollars: 32.7, 26.7, 24, 20.7, 16.6, 14.5, 13.2, 10.9, 9.5, 8.1 and 6.9. The lab below opens on these data. Fit the linear model, then the quadratic, then the exponential. Each time, look at the residual plot underneath and type 15 and then 20 into the prediction box.
Try it · Calculate
Graphing calculator required. A car's value, in thousands of dollars, is 32.7, 26.7, 24, 20.7, 16.6, 14.5, 13.2, 10.9, 9.5, 8.1 and 6.9 at ages 0 to 10 years. Run a quadratic regression on these data. What value does the quadratic model give for a car 20 years old, in thousands of dollars? Give your answer to one decimal place.
Try it · Multiple choice
Graphing calculator required. Use the same car data, ages 0 to 10. A dealer wants to price a car that is 15 years old. Which model should the dealer use?
Part 5 Explain it
Write it the way the exam asks
Nothing you type leaves this page.
Free response is 37.5% of the exam score. This one is shaped like Question 2, Modeling a Non-Periodic Context.
Free-response practice · Question 2 style
Graphing calculator required. After a cold spell begins, the ice on a pond is measured every 2 days. The thickness is 3.0, 6.2, 8.8, 10.6, 12.2 and 13.2 centimeters at and 10 days. (a) Find the linear regression and the quadratic regression for these data. (b) In order of , the residuals of have signs and the residuals of have signs . Explain which model is more appropriate for these data. (c) Find the residual of at , and state whether overestimates or underestimates the thickness there. (d) People wait for the ice to be at least 10 centimeters thick before walking on it. Explain whether an overestimate or an underestimate of the thickness is the safer error for this decision.
Model answer
(a) and . (b) The residuals of are negative at both ends and positive in the middle, an upside-down U, so the line misses the bend in the data. The residuals of change sign with no shape. So is the more appropriate model. (c) , so the residual is centimeters. It is negative, so overestimates the thickness at day 10. (d) An underestimate is safer. If the model says the ice is thicker than it is, someone could walk onto ice under 10 centimeters. If it says the ice is thinner than it is, people only wait a little longer than they needed to.
Score your own answer. This is a self-check, not a grade. Tick each point your answer makes.
Part 6 Check yourself
Patients at a clinic
The three case questions use the same table. Answer them from it.
During a flu outbreak a clinic counts the patients it sees each day. It fits a linear model and an exponential model , where is days since the count began. The table gives each model's prediction next to the actual count. The clinic schedules its nurses from the forecast.
| (days) | Patients | ||
|---|---|---|---|
| 0 | 12 | 7.75 | 12.06 |
| 1 | 16 | 15.21 | 15.66 |
| 2 | 20 | 22.68 | 20.33 |
| 3 | 26 | 30.14 | 26.39 |
| 4 | 35 | 37.61 | 34.26 |
| 5 | 44 | 45.07 | 44.48 |
| 6 | 58 | 52.54 | 57.75 |
Case question 1 · Calculate
No calculator. What is the residual of the linear model on day 6, in patients?
Case question 2 · Multiple choice
No calculator. Find the sign of each residual (actual minus predicted) of the linear model , in order of day. Is an appropriate model for these data?
Case question 3 · Multiple choice
No calculator. On days 2 to 5 the residuals of are negative. If the clinic had scheduled nurses from on those days, what would have happened?
The rest stand on their own and do not use the case.
Check yourself · Spot the error
No calculator. A food truck's model predicts 132 lunches on Friday, and the truck sells 120. A student works out what the residual says. Tap the first line with a mistake.
Check yourself · Sort it
No calculator. Each situation gives a clue about which kind of model fits it. Tap a situation, then the model its context supports.
Linear
Quadratic
Exponential
Part 7 Keep it
Bring back earlier ideas
Pulling an older idea back up is what makes it last.
A nurse records the amount of a medicine left in a patient's bloodstream every hour after a dose. The ratios of consecutive readings sit between about 0.84 and 0.87, close to constant but not exactly, which is what real measurements look like. That makes this a job for an exponential regression. Enter the hours and the amounts as two lists and run ExpReg, which reports a model .
| (hours) | (milligrams) |
|---|---|
| 0 | 250 |
| 1 | 212 |
| 2 | 181 |
| 3 | 152 |
| 4 | 131 |
| 5 | 110 |
| 6 | 94 |
From 2.5 Exponential Function Context and Data Modeling · Calculate
Graphing calculator required. The amount of a medicine in the bloodstream, in milligrams, is 250, 212, 181, 152, 131, 110 and 94 at hours. Run an exponential regression on these data. By what percent does the amount decrease each hour, according to the model? Round only at the end, and give a percent to one decimal place.
From 1.14 Function Model Construction and Application · Fill the statement
No calculator. A bike rental costs 12 dollars for up to 2 hours, then 5 dollars for each extra hour. Tap a blank, then tap a phrase.
The cost model has for and for .
In three lines
- Data whose rate of change changes slightly can often be fit closely by a linear, a quadratic and an exponential model at once.
- Residual = actual minus predicted. A model is appropriate when its residual plot has no pattern; a U or a trend means it misses structure.
- When several models pass, let the context choose, and use the signs of the residuals to see where a model overestimates or underestimates.
Vocabulary
- Residual
- For a given input, the actual value of the dependent variable minus the value the regression model predicts.
- Residual plot
- A graph of the residuals of a regression, with the residuals on the vertical axis and the independent variable on the horizontal axis.
- Appropriate model
- A model justified for a data set because its residual plot appears without pattern and its behavior makes sense in the context.
- Error
- The difference between a model's prediction and the actual value at an input, read either as a signed residual or as its absolute value.
- Overestimate
- A prediction above the actual value, shown by a negative residual.
- Underestimate
- A prediction below the actual value, shown by a positive residual.
Course alignment, for teachers
AP Precalculus topic 2.6, Unit 2: Exponential and Logarithmic Functions.
- Skill 2.A: Identify information from graphical, numerical, analytical, and verbal representations to answer a question or construct a model, with and without technology.
- Skill 3.C: Support conclusions or choices with a logical rationale or appropriate data.
This lesson maps all 4 essential knowledge statements of the topic to the part that teaches each one: 4 are checked by a scored question. The map is in the lesson file.