Unit 3 · Topic 3.1 · about 30 minutes · 7 parts · 14 scored checks, 4 of them multiple choice
Periodic Phenomena
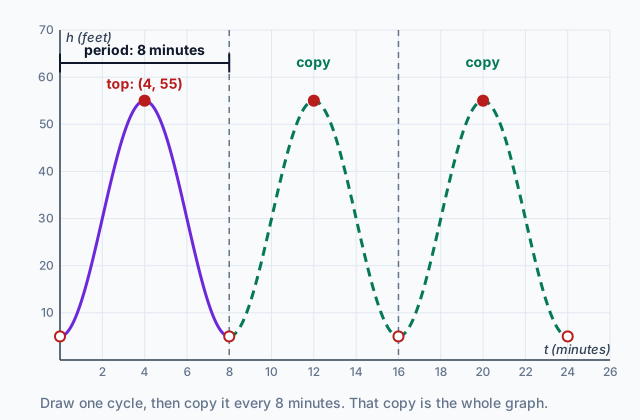 Tap to open the picture full size
Part 1 Think first
Where is your seat?
Guess before you learn. A wrong guess still makes the answer stick.
Predict first
A Ferris wheel turns at a steady speed and takes 8 minutes to make one full turn. You board at the bottom, and the wheel keeps turning without stopping. Where is your seat 50 minutes later?
In short. A periodic relationship is one whose output values repeat the same pattern over successive input intervals of equal length, and the length of the shortest such interval is the period.
- The period is the smallest positive with for every in the domain. In a table, find where the outputs start over, and check every value, not just one.
- One cycle is enough. Copy it every units to draw the whole graph, and take out whole periods to find a far-off output, since for any integer .
- Whatever the function does in one period, where it increases or decreases, how it bends and how fast it changes, it does in every period.
Part 2 Learn it
Four short ideas, each checked as you go
2a. A pattern that repeats
Ride a Ferris wheel and your height keeps changing, but not at random. You start at the bottom, 5 feet off the ground, climb to the top, 55 feet up, and come back down. Then the next turn does exactly the same thing and takes exactly as long.
That is a periodic relationship: as the input values increase, the output values repeat a pattern over successive equal-length intervals. Here the input is time and the output is your height.
Both halves of that sentence matter. A dropped ball goes up and down too, but each bounce is lower than the last, so its heights never come back. A heartbeat during a sprint repeats the same shape, but each beat comes a little sooner, so the intervals keep shrinking. Neither is periodic. The same outputs have to return, and they have to return on intervals of the same length.
The pattern does not have to look like a smooth wave. A resting heartbeat on a hospital monitor is a nearly flat line broken by a sharp spike, again and again, a second apart. That is periodic too.
Quick check · Sort it
No calculator. Each card describes a quantity changing over time. Tap a card, then whether the relationship is periodic.
Periodic
Not periodic
2b. Find the period
Suppose nobody told you how long one turn takes. A sensor on your seat logs its height , in feet, every minute.
| 0 | 1 | 2 | 3 | 4 | 5 | 6 | 7 | 8 | 9 | 10 | 11 | 12 | |
|---|---|---|---|---|---|---|---|---|---|---|---|---|---|
| 5 | 12.3 | 30 | 47.7 | 55 | 47.7 | 30 | 12.3 | 5 | 12.3 | 30 | 47.7 | 55 |
Read along the outputs until they start over. At 8 minutes the list begins again: 5, 12.3, 30, and so on. Every height at matches the height at .
The period is the smallest positive value with for all in the domain. Two parts of that do the work.
For all . The height 30 shows up at 2 minutes and again at 6, but 4 is not the period. Shift 3 minutes by 4 and you land on 7, where the height is 12.3, not 47.7. One matching pair proves nothing.
Smallest. A shift of 16 also brings back every height, because 16 minutes is two turns. The period is still 8, the shortest shift that works.
A table shows only some inputs, so a period read from one is an estimate. You are trusting that the seat behaves between readings the way it does at them.
Quick check · Multiple choice
No calculator. A periodic function has the values 2, 5, 3, 5, 2, 5, 3, 5, 2, 5, 3 at , in that order. Based on these values, what is the smallest period that fits them?
2c. One cycle builds the whole graph
Once you know the period, one cycle is all you need. The diagram shows it for the Ferris wheel. Draw the seat's height from 0 to 8 minutes, then copy that piece 8 minutes to the right, and again, and again. Each copy has the same shape at the same heights. That is how the graph of any periodic relationship is built: from the graph of a single cycle.
Any interval 8 minutes wide works as the piece you copy. From 3 to 11 minutes the seat still makes exactly one full turn, starting partway up instead of at the bottom, so copying that piece builds the same graph.
The same idea answers questions far ahead. Since , you can add or subtract 8 as often as you like: for any integer . To find your height after 50 minutes, take out the whole turns. Six turns use 48 minutes, so
That is the Think first question: 30 feet, halfway up, still rising.
Quick check · Fill the statement
No calculator. A Ferris wheel seat's height repeats every 8 minutes, and the cycle from 0 to 8 minutes is one full turn. Tap a blank, then tap an answer.
From 0 to 32 minutes, the graph of the seat's height is made of complete cycles like the one from 0 to 8 minutes. The height at 61 minutes equals the height at minutes, a time within that first cycle.
2d. One period shows every behavior
Inside one turn, the seat's height behaves like functions you already know. From 0 to 4 minutes it is increasing, from its minimum of 5 feet to its maximum of 55. From 4 to 8 it is decreasing, back to 5.
The rate of change is not steady. Near the bottom and the top the seat moves mostly sideways, so its height changes slowly. Partway up it rises fastest. The sensor readings show it: the seat climbs 7.3 feet from minute 0 to 1, then 17.7 feet from 1 to 2, 17.7 again from 2 to 3, and only 7.3 from 3 to 4.
That tells you the concavity. From 0 to 2 the rate of change is increasing, so the graph is concave up. From 2 to 6, through the top, the rate of change is decreasing, so the graph is concave down. From 6 to 8 it is concave up again.
Every one of those features comes back in every period, shifted by a multiple of 8. The height increases from 16 to 20 minutes, peaks at 20, is concave down from 18 to 22, and climbs fastest around 18. To describe a periodic function completely, describe one period.
Quick check · Match
No calculator. A Ferris wheel seat's height repeats every 8 minutes. In the first turn it increases from 5 feet at 0 minutes to 55 feet at 4 minutes, then decreases back to 5 feet at 8 minutes. It is concave up from 0 to 2 minutes and from 6 to 8 minutes, and concave down from 2 to 6 minutes. Tap a time, then what the height does then.
Part 3 Watch it done
Predicting the tide from one cycle
Watch each step, then do the last one yourself.
A tide gauge at a harbor reads the water depth , in feet, hours after midnight. At it reads 6.0, 8.4, 11.2, 12.5, 10.1, 7.0, 6.0, 8.4, 11.2, 12.5, 10.1, 7.0, 6.0. Estimate the period of , then predict the depth 70 hours after midnight.
Step 1 · Look for the restart
The first reading, 6.0, does not appear again until . From there the readings run 6.0, 8.4, 11.2, 12.5, 10.1, 7.0, the same list as from 0 to 10.
Step 2 · Check every reading
Pair each reading with the one 12 hours later: , , and so on up to . Every pair matches, so the period is about 12 hours. It is an estimate, because the gauge reports only every 2 hours.
Why this step?
Why does looking only at the reading 6.0 rule out a period shorter than 12 hours?
A period has to give , along with every other match. Before hour 12, no reading equals , so no shorter shift the table can show passes even that first test.
Your step · Calculate
No calculator. Finish it. The depth repeats every 12 hours. What is the depth, in feet, 70 hours after midnight?
Part 4 Try it
Draw the lighthouse from words
A lighthouse lamp turns at a steady speed, once every 10 seconds. From a boat offshore, the light looks dark for 8 seconds. Then it brightens over 1 second to a full flash and fades over the next second back to dark. Every turn of the lamp repeats this. Let be the brightness the sailor sees seconds after the light goes dark.
Nobody gives you a table or a graph here, only that description. Sketch one cycle, from 0 to 10 seconds, on scrap paper before you answer.
Try it · Multiple choice
No calculator. A lighthouse lamp turns once every 10 seconds. A sailor sees it dark for 8 seconds, then brightening for 1 second to a full flash, then fading for 1 second, over and over, starting dark at . Which describes the graph of the brightness from to seconds?
Try it · Spot the error
No calculator. A lighthouse lamp turns once every 10 seconds. In each turn the sailor sees it dark for the first 8 seconds, then a flash that peaks at 9 seconds and fades to dark at 10. A student predicts what the sailor sees 57 seconds after the light first goes dark. Tap the first line with a mistake.
Part 5 Explain it
Write it the way the exam asks
Nothing you type leaves this page.
Free response is 37.5% of the exam score. This one is shaped like Question 3, Modeling a Periodic Context.
Free-response practice · Question 3 style
No calculator. A paddle on a mill's water wheel turns at a steady speed. Let be the height of the paddle's tip, in feet, above the water surface, seconds after it passes the top of the wheel, 3 feet above the water. The wheel's hub sits right at the water surface. The tip falls slowly at first, fastest as it passes the water surface at , then more and more slowly until it reaches the bottom, 3 feet below the surface, at . It rises the same way: slowly at first, fastest as it passes the surface at , and slowing to the top at . Then the motion repeats. (i) Identify the period of , and explain what it means in context. (ii) Find , and explain your reasoning. (iii) On the interval , is increasing or decreasing, and is the rate of change of increasing or decreasing? Explain your reasoning.
Model answer
(i) The period is 12 seconds. That is the time for one full turn of the wheel: every 12 seconds the tip passes through the same heights again, so , and no shorter time works. (ii) , and 48 seconds is four periods, so . The tip is at the water surface. (iii) The interval is shifted by 24 seconds, two periods. On the tip rises from the bottom to the surface, so is increasing. It starts slowly and is rising fastest at the surface, so the rate of change of is increasing.
Score your own answer. This is a self-check, not a grade. Tick each point your answer makes.
Part 6 Check yourself
A greenhouse that repeats itself
The three case questions use the same table. Answer them from it.
A greenhouse controller logs the air temperature , in degrees Celsius, every 3 hours, where is the number of hours after midnight at the start of its first day. The table gives the first 48 hours of readings. The pattern of readings keeps repeating after that, exactly as it does in the table.
| (hours) | |
|---|---|
| 0 | 18 |
| 3 | 16 |
| 6 | 18 |
| 9 | 24 |
| 12 | 29 |
| 15 | 31 |
| 18 | 26 |
| 21 | 21 |
| 24 | 18 |
| 27 | 16 |
| 30 | 18 |
| 33 | 24 |
| 36 | 29 |
| 39 | 31 |
| 42 | 26 |
| 45 | 21 |
| 48 | 18 |
Case question 1 · Multiple choice
No calculator. Using the table of greenhouse temperatures and the pattern it repeats, which interval has the same average rate of change of as the interval from to ?
Case question 2 · Calculate
No calculator. Using the table of greenhouse temperatures and the period it shows, what is , in degrees Celsius?
Case question 3 · Multiple choice
No calculator. Using the table of greenhouse temperatures and the pattern it repeats, on which interval do the temperatures increase at every 3-hour step?
The rest stand on their own and do not use the case.
Check yourself · Decide and justify
No calculator. A Ferris wheel seat's height repeats every 8 minutes. In the first turn, its heights at 0, 1, 2, 3 and 4 minutes are 5, 12.3, 30, 47.7 and 55 feet. Is the seat rising faster from 17 to 18 minutes or from 19 to 20 minutes?
Which reason supports your answer?
Check yourself · Spot the error
No calculator. A bike pedal's height above the ground, in inches, is recorded every 0.25 second while the rider pedals at a steady pace. A student estimates the period of the height. Tap the first line with a mistake.
Part 7 Keep it
Bring back earlier ideas
Pulling an older idea back up is what makes it last.
From 2.7 Composition of Functions · Sort it
No calculator. Each function is built from a function by composing it with . Tap a card, then what happens to the graph of .
Horizontal translation
Vertical translation
Horizontal dilation
Vertical dilation
From 1.13 Function Model Selection and Assumption Articulation · Calculate
No calculator. A phone plan costs 30 dollars a month for up to 5 gigabytes of data, then 10 dollars for each extra gigabyte. What is the bill, in dollars, for 8 gigabytes?
In three lines
- A periodic relationship repeats its outputs over successive equal-length input intervals; going up and down is not enough.
- The period is the smallest positive with for all , so check every output, then take out whole periods to predict far ahead.
- One cycle builds the whole graph, and its increasing and decreasing intervals, concavity and rates of change repeat in every period.
Vocabulary
- Periodic relationship
- A relationship in which, as the input values increase, the output values repeat a pattern over successive equal-length intervals.
- Period
- The smallest positive value such that for all in the domain.
- Cycle
- One full run of a periodic pattern, over an interval as wide as the period; the whole graph is built from copies of a single cycle.
- Concavity
- Whether a graph bends upward, concave up, where the rate of change is increasing, or downward, concave down, where the rate of change is decreasing.
Course alignment, for teachers
AP Precalculus topic 3.1, Unit 3: Trigonometric and Polar Functions.
- Skill 2.B: Construct equivalent graphical, numerical, analytical, and verbal representations of functions that are useful in a given mathematical or applied context, with and without technology.
- Skill 3.A: Describe the characteristics of a function with varying levels of precision, depending on the function representation and available mathematical tools.
This lesson maps all 5 essential knowledge statements of the topic to the part that teaches each one: 5 are checked by a scored question. The map is in the lesson file.