Unit 3 · Topic 3.14 · about 30 minutes · 7 parts · 13 scored checks, 2 of them multiple choice
AP Precalculus 3.14: Polar Function Graphs
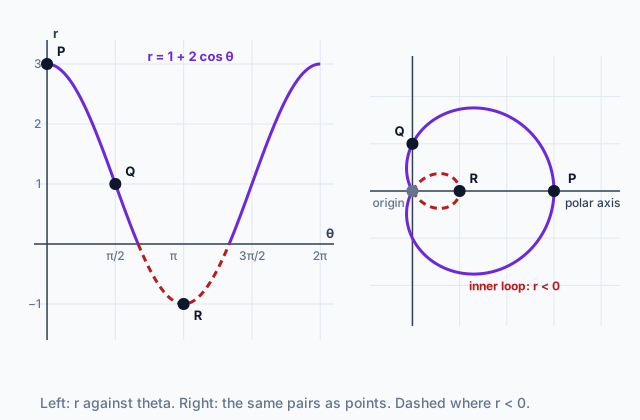 Tap to open the picture full size
Part 1 Think first What does r = 2 cos theta look like?
Guess before you learn. A wrong guess still makes the answer stick.
Predict first
Maya switches her graphing calculator to polar mode and types . On rectangular axes, is a wave. What do you expect on the polar screen?
In short. The graph of a polar function is every point you get by feeding in an angle and taking the radius that comes out.
- To plot a pair, turn to the angle from the polar axis, then move units along that ray. A negative sends you the other way, through the origin onto the opposite ray.
- The graph of against on rectangular axes reads straight across: moving right means the ray turns counterclockwise, and the height is the signed distance out along it. Where that graph meets the -axis, the polar graph passes through the origin.
- To draw only part of the curve, restrict to an interval whose endpoints are the angles that produce the points where that part starts and ends.
Part 2 Learn it Four ideas, each checked as you go
2a. Angles in, radii out
A polar function is a function like any other: one input, one output. The input is an angle, measured from the polar axis. The output is a radius. Each input and its output make the point , and the graph is all of those points.
Take and make a table, the way you would for any function.
| Point | Where it lands | ||
|---|---|---|---|
| 5 units along the polar axis | |||
| 3 units straight up | |||
| 1 unit to the left | |||
| 3 units straight down |
To plot a pair, turn to the angle first, then go out along that ray by . Join enough points in order of and the curve appears. This one is wide on the right, where is near 5, and tucked close to the origin on the left, where is near 1.
Watch the order inside the pair. The input is , but polar coordinates write the radius first: . Swapping them, or putting the angle's value where the radius goes, is the slip to watch for.
Quick check · Fill the statement
No calculator. The polar function is , with in radians. Tap a blank, then tap a value.
The input gives the point with polar coordinates (, ).
2b. Read the graph of r against theta
You already know how to graph on ordinary axes. That graph is the fastest way to the polar graph of , and it is the left panel of the diagram: across, up.
Read it with two rules. Moving right along the -axis means the ray turns counterclockwise from the polar axis; going from 0 to is a quarter turn. The height of the graph is how far out along that ray the point sits. When the rectangular graph climbs, the point slides out along the turning ray. When it falls toward the axis, the point slides in.
For , from to the height falls from 3 to 1 while the ray turns from the polar axis to straight up. On the polar graph, the point moves from P, 3 units out on the polar axis, around to Q, 1 unit up.
Where the rectangular graph touches the -axis, : zero units out, so the polar graph passes through the origin. For this function that happens at and .
Quick check · Match
No calculator. Each change is read from the graph of a polar function drawn on rectangular axes, with across and up. Tap a change, then what it means for the point on the polar graph.
2c. When r is negative
Between and the rectangular graph of dips below the axis, as low as at . The output is a signed radius. You still turn to , but a negative sends you backward through the origin, onto the ray that points the opposite way, units out.
At the ray points left and , so you step 1 unit to the right. That is R in the diagram, the rectangular point : on the right of the origin, although the angle points left.
This is where the small inner loop comes from. As runs from to , the ray sweeps across the left side of the plane, but every point lands on the opposite ray, on the right side. The dashed piece in each panel is that stretch.
So the sign of tells you which way along the line to go, and tells you how far.
Quick check · Decide and justify
No calculator. The graph of for is a circle. If continues from to , does the graph gain any point that is not already on that circle?
Which reason supports your answer?
2d. Draw only the part you want
The full graph comes from letting run over a whole interval, often . To draw only one piece, restrict . The endpoints of the restriction are the angles at which the piece starts and ends, so find them from the points: for each end, ask which , with which , produces that point.
With , say you want only the inner loop. It starts and ends at the origin, where , so restrict to . Want the piece from P to Q instead? P comes from with , and Q from with , so use .
An endpoint is an angle, never a radius. Writing because P is 3 units out mixes the two up. And when is negative, the direction you see the point in is not its . R sits on the polar axis, but it comes from , not .
One more thing to watch: a longer interval is not always a bigger picture. Some curves are finished before reaches , and the rest of the turn draws over them again.
Quick check · Multiple choice
No calculator. The graph of is a circle through the origin, centered at the rectangular point . Which restriction on draws exactly the half of the circle that lies on or above the -axis?
Part 3 Watch it done From a wave to a curve with a loop
Watch each step, then do the last one yourself.
Sketch the polar graph of for , using its graph on rectangular axes.
Step 1 · Graph r against theta first
On rectangular axes, is a sine wave with midline and amplitude 2. It starts at 1, peaks at 3 when , is back to 1 at , and bottoms out at when . Somewhere between and it spends a stretch below the -axis.
Step 2 · From 0 to pi, r stays positive
On this stretch goes 1, up to 3, back down to 1, and never reaches 0. The ray turns from the polar axis, through straight up, to straight left, and the point rides out along it: from to to in rectangular terms. That is the big outer arc.
Why this step?
Why does that whole arc lie above the -axis?
Every angle strictly between 0 and has a terminal ray pointing into the upper half of the plane, and is positive there, so each point sits on its own terminal ray. In rectangular terms, is a positive times a positive.
Step 3 · Past pi, r falls through 0
After the rectangular graph keeps falling and crosses the -axis. At that angle the polar graph reaches the origin. Then is negative, so the points land on opposite rays. The rays point down, so the points appear above the origin, tracing a small loop inside the big arc. The graph crosses the axis a second time, the curve passes through the origin again, and it swings back out to at .
Your step · Calculate
No calculator. Finish it. For , the polar graph of passes through the origin twice. It reaches the origin the first time at . What is ? Give the exact value; a fraction such as 5/3 is fine.
Part 4 Try it Loops that land somewhere else
The lab is set to , drawn as against under the polar graph. Each curve is solid where and dashed where , and the stretch between the two interval sliders is drawn bold. The lab calls the origin the pole.
Try it · Fill the statement
No calculator. The polar function is , with in radians. Each quarter turn of draws one loop of the graph. Tap a blank, then tap a quadrant.
Restricted to , the graph is a loop in Quadrant . Restricted to , it is a loop in Quadrant .
Try it · Calculate
No calculator. On the graph of the polar function , what is the -coordinate, in rectangular coordinates, of the point for ?
Part 5 Explain it Write it the way the exam asks
Nothing you type leaves this page. Check your answer against the model and each scoring point.
Free response is 37.5% of the exam score. This one is shaped like Question 4, Symbolic Manipulations.
Free-response practice · Question 4 style
No calculator. The polar function is given by for . (A) Identify every value of in that interval at which the polar graph of passes through the origin. Explain how you know. (B) Identify the quadrant that contains the point on the graph for . Explain your reasoning. (C) The graph contains the rectangular points , and . Determine an interval of that draws exactly the portion of the graph that starts at , passes through and ends at .
Model answer
(A) The graph is at the origin where . gives , so and . (B) , which is negative because . A negative puts the point on the ray opposite the terminal ray of , which is the ray at , so the point is in Quadrant III. (C) comes from , where . comes from , where . comes from , where . On , , so and the curve runs from through to without reaching the origin. The interval is .
Score your own answer. This is a self-check, not a grade. Tick each point your answer makes.
Part 6 Check yourself A curve given by a table
The two case questions use the same polar function. Answer them from its formula and the table.
The polar function is given by , with in radians. The table lists selected values.
Case question 1 · Sort it
No calculator. The polar function is given by . Each card is an input , in radians. Tap a card, then where the point lies.
On the terminal ray of
At the origin
On the ray opposite the terminal ray of
Case question 2 · Multiple choice
No calculator. The polar function is given by , with , and . As increases, which restriction draws exactly the portion of the graph that starts at the rectangular point , passes through the origin and ends at the rectangular point ?
The rest stand on their own and do not use the case.
Check yourself · Spot the error
No calculator. A student locates the point on the graph of the polar function for . Tap the first line that goes wrong.
Check yourself · Put it in order
No calculator. The polar graph of is drawn as increases from 0, for . Each point is written in rectangular coordinates . Tap the points in the order the graph reaches them.
Part 7 Keep it Bring back earlier ideas
Pulling an older idea back up is what makes it last.
From 3.13 Trigonometry and Polar Coordinates · Spot the error
No calculator. A student converts the polar point to rectangular coordinates. Tap the first line that goes wrong.
From 3.3 Sine and Cosine Function Values · Calculate
No calculator. A circle of radius 12 is centered at the origin. The terminal ray of an angle of radians in standard position meets the circle at . What is the -coordinate of ?
In three lines
- A polar graph is the set of points : turn to the input angle, then go out by the output radius.
- Read the graph of against : across is turning, up is signed distance, and a zero of is a pass through the origin. Negative means the opposite ray.
- Restrict to the angles that produce the start and end points of the piece you want.
Vocabulary
- Polar function
- A function whose input values are angle measures and whose output values are radii.
- Graph of a polar function
- All the input-output pairs of , plotted as points in polar coordinates.
- Polar axis
- The positive -axis, from which every angle is measured.
- Signed radial displacement
- The output , read as a distance from the origin with a sign: positive along the terminal ray of , negative along the opposite ray.
- Restricted domain
- An interval of chosen so the graph shows only a desired portion, with endpoints at the angles that produce the start and end points.
Course alignment, for teachers
AP Precalculus topic 3.14, Unit 3: Trigonometric and Polar Functions.
- Skill 2.B: Construct equivalent graphical, numerical, analytical, and verbal representations of functions that are useful in a given mathematical or applied context, with and without technology.
- Skill 3.A: Describe the characteristics of a function with varying levels of precision, depending on the function representation and available mathematical tools.
This lesson maps all 3 essential knowledge statements of the topic to the part that teaches each one: 3 are checked by a scored question. The map is in the lesson file.