Unit 3 · Topic 3.7 · about 30 minutes · 7 parts · 14 scored checks, 1 of them multiple choice
AP Precalculus 3.7: Sinusoidal Function Context and Data Modeling
 Tap to open the picture full size
Part 1 Think first When can the boat get in?
Guess before you learn. A wrong guess still makes the answer stick.
Predict first
A small harbor's tide table (invented) shows low water, 0.4 meters, at 11:00 a.m. and the next high water, 3.2 meters, at 5:12 p.m. A fishing boat needs 1.1 meters of water at the harbor entrance to get in. That is a quarter of the way up from low to high. At about what time does the water reach 1.1 meters?
In short. A sinusoidal function model describes a periodic situation, and you build it from the context's maximum, minimum and period plus one known input-output pair, or by running a sinusoidal regression on data.
- The midline is the average of the maximum and minimum, the amplitude is half their difference, and the time between consecutive maxima is the period, so .
- The phase shift comes from comparing an actual input-output pair with the model: cosine is at its maximum where its input is 0, and sine is on its midline going up there.
- Inside its contextual domain, the model predicts an output from an input, and it gives the inputs where the output reaches a stated value.
Part 2 Learn it Four short ideas, each checked as you go
2a. Midline, amplitude and period from the context
A sinusoidal model , or the same with cosine, has four numbers to fill in. A context usually hands you three of them.
The maximum and minimum give the vertical numbers. The midline is their average, , and the amplitude is half their difference, .
The time from one maximum to the next, or one minimum to the next, is the period. Since the period is , when is positive. The frequency is , in cycles per unit of input.
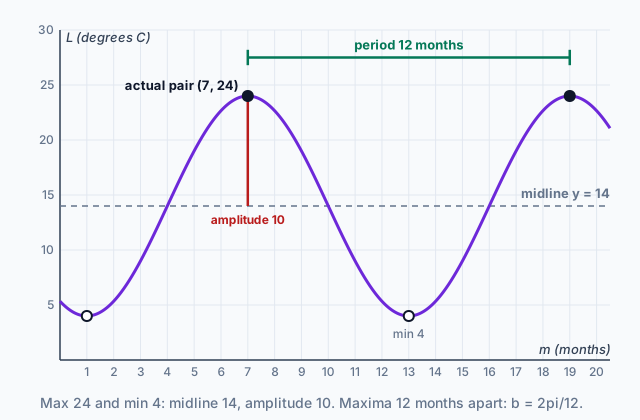
A lake (invented) is coldest, 4 degrees Celsius, in late January and warmest, 24 degrees, in late July, every year. Count months so that is late January and is late July. Then and the amplitude is 10. The warmest point returns every 12 months, so and the frequency is of a cycle per month.
Keep the period and apart. The period is a time, 12 months; is what makes the input to cosine or sine run through in that time.
Quick check · Fill the statement
No calculator. In a desert town (invented), the air temperature follows the same cycle every day. It is highest, 36 degrees Celsius, at 3 p.m., and lowest, 16 degrees Celsius, at 3 a.m. Tap a blank, then tap an answer.
A sinusoidal model of the temperature has midline and amplitude . The highs are hours apart, so that is the period, and the frequency is cycle per hour.
2b. The phase shift, from one actual pair
Midline, amplitude and fix the shape. The phase shift slides it into line with the context, and you find it by comparing an actual input-output pair with the pair the model gives.
Choose a pair the basic graph makes easy. Cosine is at its maximum where its input is 0. Sine is on its midline, going up, where its input is 0. So if you know when the context peaks, use cosine and make the inside 0 at that time.
The lake peaks at , so
At the inside is 0, , and , the actual maximum. In the form , that is , a phase shift of 7 to the right.
The sign is where models go wrong. is 0 at , but is 0 at . Put the actual pair back in every time.
Sine works too, from a different pair. The lake crosses its midline going up halfway between January and July, at , so draws the same curve.
Quick check · Decide and justify
No calculator. The water depth at a pier (invented) is greatest, 5 meters, at hours after midnight, and least, 1 meter, at . Which model fits these facts?
Which reason supports your answer?
2c. With technology: estimate, or run a regression
With data instead of a story, technology gives you two ways in.
Estimate the key values. Plot the data on a graphing calculator, read off the largest and smallest outputs and the inputs of two maxima in a row, and build the model by hand as above. Real data are noisy, so these are estimates; compare the model with a few actual pairs and adjust.
Run a sinusoidal regression. Enter the data as two lists and choose SinReg. It finds the four parameters that make the squared residuals smallest, like the earlier regressions. It needs data covering at least one full cycle, with several points in each cycle.
The result can look different from your model and still be the same curve. Some calculators print ; rewrite as for the form used here. A regression may also give a negative , a that differs from yours by a whole period, or a sine where you used a cosine. To compare two models, compare midline, amplitude, period and where each reaches its maximum.
Quick check · Sort it
No calculator. A student's model for a data set is , which has its maximum at . Each card is a model a classmate got for the same data, by regression or by hand. Tap a card, then whether it draws the same curve.
Same curve as
A different curve
2d. Using the model: predict, solve, and stay in the domain
Once you have a model, it answers two kinds of question.
Predict an output. Substitute the input, and check what the input means first. If counts hours after 6 a.m., then 11 a.m. is , not 11.
Find an input. Set the model equal to the output and solve. Without a calculator, the value will lead to a sine or cosine you know, such as . A sine equals twice in each cycle, once going up and once going down, so pick the one the question asks for. With a graphing calculator, graph the model and the horizontal line at that output, and read off the intersection you want.
Then ask whether the input makes sense. A model is useful over its contextual domain, the inputs the situation actually covers. A Ferris wheel model describes a rider only while the ride runs. A model fit to one week of greenhouse readings says nothing about a different season. Outside that domain the formula still produces a number, but the number is not about anything.
Quick check · Calculate
No calculator. On a school day, the temperature in a classroom is modeled by degrees Celsius, where is the number of hours after 6 a.m., for . What temperature does the model predict at 11 a.m.?
Part 3 Watch it done A Ferris wheel, from its numbers to a time
Watch each step, then do the last one yourself.
A Ferris wheel (invented) carries its seats from 3 meters above the ground at the bottom to 43 meters at the top, and makes one turn every 12 minutes. A rider boards at the bottom at . Write a model for the rider's height in meters after minutes, then find the first time after boarding that the rider is 33 meters above the ground.
Step 1 · Midline and amplitude
From the top and bottom heights: The 23 is the height of the wheel's center.
Step 2 · Period, then b
One turn takes 12 minutes, so the period is 12 and .
Step 3 · Phase shift from an actual pair
Sine is on its midline, going up, where its input is 0. The rider starts at the bottom and reaches the height of the center, going up, a quarter turn later, at . So the inside should be 0 at : Check against the actual pair : .
Why this step?
Why and not ?
The inside has to be 0 at , and is 0 there. With the inside is 0 at , three minutes before boarding, and : the model would start the rider at the top.
Your step · Calculate
No calculator. Finish it. A rider's height on a Ferris wheel is modeled by meters, minutes after boarding at the bottom. What is the first time after boarding that the rider is 33 meters above the ground?
minutes
Part 4 Try it Fit the tide and use the model
Here are water heights at a harbor (invented data), in meters, every 2 hours from midnight, , to midnight the next night, : 1, 2.07, 2.97, 2.79, 1.65, 0.72, 0.76, 1.92, 2.88, 2.9, 1.9, 0.79 and 0.74. Before you open the lab, find the highest and lowest readings and the hours of two high readings in a row, and estimate the midline, amplitude and period yourself.
The lab below opens on these data with the sinusoidal family selected. It prints the model in the form with five significant figures, and under it the period , the midline and the amplitude. Compare them with your estimates. Then answer the two questions with the model, using the lab's graph and its Predict y at x = box or a graphing calculator.
Try it · Calculate
Graphing calculator required. The water height at a harbor, in meters, was recorded every 2 hours from (midnight) to hours: 1, 2.07, 2.97, 2.79, 1.65, 0.72, 0.76, 1.92, 2.88, 2.9, 1.9, 0.79 and 0.74 (invented data). Run a sinusoidal regression on these data. The harbor closes its inner channel whenever the water height is below 1.2 meters. According to the model, at what time between and does the water height fall below 1.2 meters? Give your answer to the nearest tenth of an hour.
Try it · Calculate
Graphing calculator required. The water height at a harbor, in meters, was recorded every 2 hours from (midnight) to hours: 1, 2.07, 2.97, 2.79, 1.65, 0.72, 0.76, 1.92, 2.88, 2.9, 1.9, 0.79 and 0.74 (invented data). Run a sinusoidal regression on these data. Large boats can use the inner channel only while the water height is above 2.6 meters. According to the model, how many hours does each of those stretches last? Give your answer to the nearest hundredth of an hour.
Part 5 Explain it Write it the way the exam asks
Nothing you type leaves this page. Check your answer against the model and each scoring point.
Free response is 37.5% of the exam score. This one is shaped like Question 3, Modeling a Periodic Context.
Free-response practice · Question 3 style
No calculator. A weight hangs from a spring and bobs up and down after it is pulled and let go. For the first few seconds, before the bouncing dies down, its height above a table, in centimeters, is modeled by a sinusoidal function of time seconds. The weight is at its highest point, 32 centimeters, at , and it next reaches its lowest point, 8 centimeters, at . (A) The function is given by . Find values of the constants , , and . (B) Use the model to find the height of the weight at seconds. (C) Find all times , for , when the model gives a height of 14 centimeters. Show the work that leads to your answers.
Model answer
(A) and . Highest to lowest takes 1 second, which is half a cycle, so the period is 2 and . Sine is at its maximum where its input is , so I need , which gives . So . Check: and . (B) centimeters. (C) gives . For the input runs from to , where sine is only at and . So or , and or seconds.
Score your own answer. This is a self-check, not a grade. Tick each point your answer makes.
Part 6 Check yourself A greenhouse over two days
The two case questions use the same table. Answer them from it.
A grower records the air temperature in a greenhouse every 3 hours, starting at 3 a.m. on Monday. In the table, is the number of hours after midnight at the start of Monday, so is 3 a.m. on Tuesday. The daily pattern repeats, and the grower wants a sinusoidal model for the temperature.
| (hours) | Temperature (degrees Celsius) |
|---|---|
| 3 | 15.0 |
| 6 | 17.3 |
| 9 | 21.8 |
| 12 | 27.1 |
| 15 | 29.0 |
| 18 | 26.7 |
| 21 | 22.2 |
| 24 | 16.9 |
| 27 | 15.0 |
| 30 | 17.2 |
| 33 | 21.9 |
| 36 | 27.0 |
| 39 | 29.0 |
Case question 1 · Calculate
No calculator. A model of the greenhouse table has the form , with , and . Use the greenhouse table to find . Give the exact value; a fraction such as 5/3 is fine.
Case question 2 · Multiple choice
No calculator. A grower models the greenhouse table with , where comes from the time between consecutive maxima. Which value of makes the model's maximum fall at , the time of an actual maximum in the table?
The rest stand on their own and do not use the case.
Check yourself · Spot the error
No calculator. A bicycle pedal's height above the road is greatest, 46 centimeters, at seconds and least, 10 centimeters, at seconds, and the rider pedals at a steady pace. A student builds a model . Tap the first line that goes wrong.
Check yourself · Put it in order
No calculator. At a harbor (invented), high tides of 2.8 meters come at 2 a.m. and 2 p.m., low tides are 0.4 meters, and a student has already found and from them. Put the rest of the work, building with in hours after midnight and then using it, in order. Tap the steps in sequence.
Check yourself · Decide and justify
No calculator. A Ferris wheel ride lasts three turns, 36 minutes in all, and a rider's height is modeled by meters, minutes after boarding. Should the operator use to report the rider's height 50 minutes after boarding?
Which reason supports your answer?
Part 7 Keep it Bring back earlier ideas
Pulling an older idea back up is what makes it last.
The function p is sinusoidal. The table gives p at the whole numbers from 0 to 8, and the chart plots more points on its graph. The maximum value of p occurs at and next at , and the minimum value between them occurs at .
Points on the graph of
Each dot is , at every half unit from 0 to 8, rounded to two decimal places.
From 3.5 Sinusoidal Functions · Decide and justify
No calculator. Is the graph of p concave up or concave down on the interval ?
Which reason supports your answer?
From 3.6 Sinusoidal Function Transformations · Sort it
No calculator. Each card is a transformation of that changes exactly one of four features of its graph: the amplitude, the period, the midline or the phase shift. Tap a card, then the feature it changes.
Amplitude
Period
Midline
Phase shift
In three lines
- The midline is the average of the maximum and minimum, the amplitude half their difference, and , with the period measured between consecutive maxima.
- Place the phase shift with an actual pair: cosine peaks where its input is 0, sine crosses its midline going up there, and the sign of is checked by putting the pair back in.
- Build from key values or a sinusoidal regression, then predict and solve only inside the contextual domain.
Vocabulary
- Period
- The input-value interval between consecutive maxima or consecutive minima, for .
- Frequency
- The reciprocal of the period: the number of cycles per unit of input.
- Amplitude
- Half the difference between the maximum and minimum output values, in .
- Vertical shift
- The value , the average of the maximum and minimum, which moves the midline from to .
- Phase shift
- The horizontal translation of units in , found by comparing an actual input-output pair with the model's.
- Sinusoidal regression
- A fit by technology, such as SinReg on a graphing calculator, of a sinusoidal function model to a data set.
- Contextual domain
- The input values the situation actually covers, over which a model's predictions mean something.
Course alignment, for teachers
AP Precalculus topic 3.7, Unit 3: Trigonometric and Polar Functions.
- Skill 1.C: Construct new functions, using transformations, compositions, inverses, or regressions, that may be useful in modeling contexts, criteria, or data, with and without technology.
- Skill 3.C: Support conclusions or choices with a logical rationale or appropriate data.
This lesson maps all 5 essential knowledge statements of the topic to the part that teaches each one: 5 are checked by a scored question. The map is in the lesson file.