Unit 3 · Topic 3.8 · about 30 minutes · 7 parts · 13 scored checks, 3 of them multiple choice
AP Precalculus 3.8: The Tangent Function
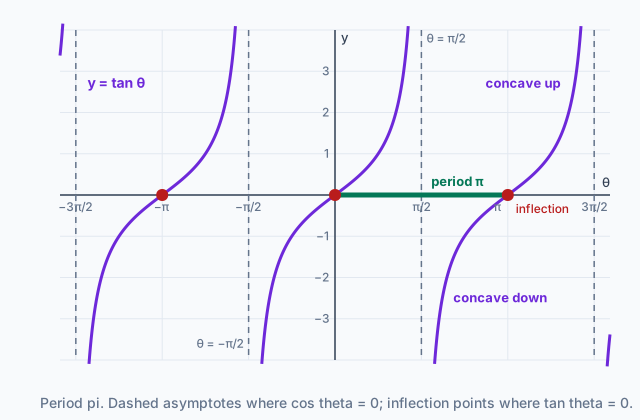 Tap to open the picture full size
Part 1 Think first Water on the fence
Guess before you learn. A wrong guess still makes the answer stick.
Predict first
A lawn sprinkler has one straight arm with a nozzle at each end, spraying in opposite directions. The arm spins at a steady rate, one full turn every 8 seconds. A long straight fence runs past it, 2 meters away. The spot where the water hits the fence slides along, runs off far down the fence, then comes back from the other end. How often does that pattern repeat?
In short. The tangent function gives the slope of an angle's terminal ray, , and its graph repeats every with a vertical asymptote wherever .
- Half a turn points the terminal ray the other way along the same line, so the slope repeats and the period of is , not .
- The graph has vertical asymptotes at , where . Between consecutive asymptotes it increases, concave down and then concave up.
- In , is a vertical dilation, the period is , the phase shift is , and the points of inflection lie on . There is no amplitude.
Part 2 Learn it Four short ideas, each checked as you go
2a. Tangent is the slope of the terminal ray
Put an angle in standard position. Its terminal ray meets the unit circle at , and the tangent function gives the slope of that ray. The ray starts at the origin, so its slope is rise over run from to :
Now add , half a turn. The new terminal ray points the opposite way along the same line through the origin, and moves to . Both coordinates change sign, so their ratio does not:
Sine and cosine need a full turn, , before they repeat. The slope repeats every half turn, so the period of the tangent function is .
Here is one pair. , because . The ray for points into Quadrant III, but it lies on the same line , so as well.
Quick check · Multiple choice
No calculator. The terminal ray of an angle in standard position meets the unit circle at . What is ?
2b. Asymptotes where cosine is zero
The quotient cannot be evaluated where . That happens at , at , at , and in general at for every integer . The terminal ray there is vertical, and a vertical line has no slope.
Watch the slope on the way there. As climbs toward the ray gets steeper and steeper: and . Just past the ray tips into Quadrant II and the slope is a huge negative number. So the graph has a vertical asymptote at every . That is the sprinkler's water running off one end of the fence and coming back from the other.
Where , at , the ray is horizontal and . Those are zeros of tangent, not asymptotes.
Between two consecutive asymptotes, say and , the tangent increases the whole way. Its graph is concave down on the left half and concave up on the right half. It changes concavity at the point of inflection halfway between, .
Quick check · Fill the statement
No calculator. Tap a blank, then tap an answer.
The graph of repeats every radians. It has vertical asymptotes at for every integer , because at those inputs. Between two consecutive asymptotes the graph increases and changes from concave to concave .
2c. Stretching and lifting: a and d
Multiply by and every output of gets multiplied by . The graph of is a vertical dilation of by a factor of . At , , so is 3 there: the same shape, only steeper. The zeros, the asymptotes and the period stay put. Three times 0 is still 0, and multiplying cannot rescue a slope that does not exist.
If , the dilation comes with a reflection over the -axis. The graph of decreases between its asymptotes instead of increasing.
Add and the whole graph moves up units. For , the points of inflection move from the -axis up to , the line containing the points of inflection.
That line is tempting to call a midline, and is tempting to call an amplitude. Both are mistakes. A sinusoid's midline sits halfway between its maximum and minimum, and its amplitude is half the distance between them. Tangent takes every real value, so it has no maximum, no minimum and no amplitude. The number tells you how steep the graph is, not how high it goes.
Quick check · Decide and justify
No calculator. A classmate says the graph of has an amplitude of 3 and a midline of . Is the classmate right?
Which reason supports your answer?
2d. Squeezing and sliding: b and c
A factor inside the tangent changes how fast the angle turns. The graph of has asymptotes where , so they sit times as far apart as the asymptotes of . The period of is .
So has period , and has period . If you remember sine, you will want to write . For tangent that is twice too long, because tangent starts from a period of . If , the graph is also reflected over the -axis.
Adding inside slides the graph sideways. The graph of is a phase shift of , so slides right by and its point of inflection moves from to .
Put together, the graph of has
- a vertical dilation by , reflected over the -axis if ,
- period and phase shift ,
- its points of inflection on the line .
One point of inflection is , and the asymptotes sit half a period to either side of it.
Quick check · Sort it
No calculator. Each card is a transformation of . Tap a card, then the period of its graph.
Period
Period
Period
Part 3 Watch it done Pin down one transformed tangent
Watch each step, then do the last one yourself.
Let . Find the first vertical asymptote of the graph of g to the right of .
Step 1 · Read the parameters
Match g to . Here , , and . Read with care: is .
Step 2 · Find the period
The period is . Consecutive asymptotes of g are 6 apart.
Step 3 · Place a point of inflection
At the output is , so is a point of inflection, on the line . Because , g decreases between its asymptotes. The asymptotes sit half a period to either side of each point of inflection.
Why this step?
Why is there a point of inflection at , and not at ?
The phase shift is . Another way to see it: has a point of inflection at , and the inside, , is 0 when . The sign inside the parentheses is the opposite of the direction of the shift.
Your step · Calculate
No calculator. Finish it. What is the -value of the first vertical asymptote of the graph of to the right of ?
Part 4 Try it Move the asymptotes yourself
The grapher draws in color over the dashed parent . Its asymptotes are dashed vertical lines and the line containing its points of inflection is a solid gray horizontal line. Use it to test the rules from Learn it before you trust them on paper.
Try it · Multiple choice
No calculator. Let . What is the -value of the first vertical asymptote of the graph of k to the right of ?
Part 5 Explain it Write it the way the exam asks
Nothing you type leaves this page. Check your answer against the model and each scoring point.
Free response is 37.5% of the exam score. This one is shaped like Question 4, Symbolic Manipulations.
Free-response practice · Question 4 style
No calculator. Let . (A) Find the exact value of . Show the work that leads to your answer. (B) Rewrite as an expression in and . Use it to find every value of at which f is not defined. (C) Find the period of f and an equation of the line containing the points of inflection of the graph of f.
Model answer
(A) . Since , , so . (B) . This is not defined where , which is where , so for every integer . (C) The period is . The vertical translation is , so the points of inflection lie on the line .
Score your own answer. This is a self-check, not a grade. Tick each point your answer makes.
Part 6 Check yourself A table of a transformed tangent
The three case questions use the same function h.
The function h is given by for every where is defined, where , and are constants with and . The graph of h has vertical asymptotes at and and no vertical asymptote between them. The table gives values of h, rounded to two decimal places where they are not whole numbers.
Case question 1 · Multiple choice
No calculator. Which equation defines h?
Case question 2 · Calculate
No calculator. What is ?
Case question 3 · Calculate
Graphing calculator required. What is ? Give a decimal to two places.
The rest stand on their own and do not use the case.
Check yourself · Spot the error
No calculator. A student finds the period and the asymptotes of . Tap the first line that goes wrong.
Check yourself · Match
No calculator. Each description is one branch of a graph: the two vertical asymptotes on either side of it, its point of inflection, and whether it rises or falls from left to right. Tap an equation, then its branch.
Part 7 Keep it Bring back earlier ideas
Pulling an older idea back up is what makes it last.
From 3.5 Sinusoidal Functions · Sort it
No calculator. Each card names a function and an open interval of in radians. Tap a card, then how the graph behaves on that whole interval.
Increasing, concave down
Decreasing, concave down
Decreasing, concave up
Increasing, concave up
From 3.7 Sinusoidal Function Context and Data Modeling · Calculate
No calculator. On a school day, the temperature in a classroom is modeled by degrees Celsius, where is the number of hours after 6 a.m., for . What temperature does the model predict at 11 a.m.?
In three lines
- is the slope of the terminal ray, and the slope repeats every half turn, so the period is .
- Vertical asymptotes sit at , where . Between them tangent increases, concave down and then concave up.
- has vertical dilation , period , phase shift , points of inflection on , and no amplitude.
Vocabulary
- Tangent function
- The function , which gives the slope of the terminal ray of and equals where .
- Period
- The tangent function has a period of , because the slope values of the terminal ray repeat every one-half revolution of the circle.
- Points of inflection
- Where the graph of changes from concave down to concave up, halfway between consecutive asymptotes; for they lie on a line moved by units.
- Vertical dilation
- The graph of is a vertical dilation of the graph of by a factor of , with a reflection over the -axis if .
- Horizontal dilation
- The graph of is a horizontal dilation of the graph of whose period differs by a factor of .
- Phase shift
- The graph of is a horizontal translation of the graph of by units.
Course alignment, for teachers
AP Precalculus topic 3.8, Unit 3: Trigonometric and Polar Functions.
- Skill 2.A: Identify information from graphical, numerical, analytical, and verbal representations to answer a question or construct a model, with and without technology.
- Skill 3.A: Describe the characteristics of a function with varying levels of precision, depending on the function representation and available mathematical tools.
This lesson maps all 10 essential knowledge statements of the topic to the part that teaches each one: 10 are checked by a scored question. The map is in the lesson file.