Unit 4 · Topic 4.14 · about 30 minutes · 7 parts · 14 scored checks, 3 of them multiple choice
AP Precalculus 4.14: Matrices Modeling Contexts
Not assessed on the AP Exam. Unit 4 is part of the course, but nothing in it is on the exam.
 Tap to open the picture full size
Part 1 Think first Where do the bikes end up?
Guess before you learn. A wrong guess still makes the answer stick.
Predict first
A bike share has 100 bikes and two stations, Riverside and Downtown. Every night, 20% of the bikes at Riverside are ridden to Downtown and the rest stay put, and 30% of the bikes at Downtown are ridden to Riverside and the rest stay put. Tonight all 100 bikes start at Riverside. What happens to the two counts over many nights?
In short. A matrix built from the percent rates at which members move between two states, multiplied by a state vector, predicts the states at later steps, and its inverse predicts earlier ones.
- Each column of the matrix shows where one state's members go in one step, in the same order as the state vector, so each column adds to 1.
- times the state vector gives the next step, times it gives the state steps later, and times it gives the step before.
- Repeated multiplication can predict the steady state, a distribution between the states that does not change from one step to the next.
Part 2 Learn it Modeling moves between two states
2a. Percents into a matrix
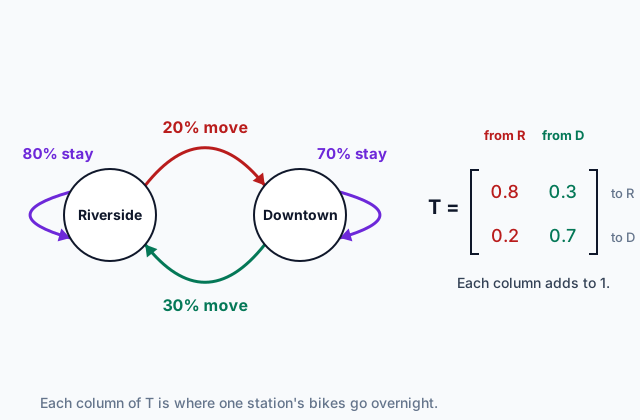
This kind of model follows a fixed group sorted into two states, here the two stations. At each step, a set percent of each state moves to the other. The counts go in a state vector, a column with one component per state. Tonight's bikes are , Riverside first, then Downtown.
The matrix that models the transitions has one column for each state the bikes leave and one row for each state they end in, both in the order of the state vector. Riverside's bikes fill column 1: 80% stay (row 1) and 20% go to Downtown (row 2). Downtown's fill column 2: 30% go to Riverside (row 1) and 70% stay (row 2).
The diagram shows the same four percents as arrows. A context often gives only the percent that switches. The percent that stays is 100% minus it, so write both. Each column of adds to 1, because every bike that starts at a station ends the night somewhere. A column that does not add to 1 loses bikes or makes new ones, so check before you multiply.
Quick check · Multiple choice
A cafeteria tracks 600 students who either buy lunch or bring lunch. Each week, 15% of the students who buy switch to bringing, and 40% of the students who bring switch to buying; everyone else keeps the same habit. The state vector lists buyers first, then bringers, and each column of shows where one group goes. Which matrix is ?
2b. One step ahead, then n steps
Multiply by a state vector and you get the state vector one step later. Say tonight there are 50 bikes at each station:
Read row 1 as a sentence: Riverside tomorrow gets 80% of its own bikes plus 30% of Downtown's. The total is still 100.
To go another night, multiply again, starting from :
A model can give half a bike; read 57.5 as about 57 or 58. After steps the state vector is , with multiplied in times, and a calculator finds as fast as . Do not add the first night's change times. Here the change shrinks each night, from 5 bikes to 2.5, so adding 5 twice would overshoot.
Quick check · Calculate
A rental company keeps 2,000 cars at two offices, Lakeside and Hilltop. Each day, 10% of the cars at Lakeside are returned at Hilltop, and 20% of the cars at Hilltop are returned at Lakeside; the rest come back to the office they left from. On Monday morning there are 1,500 cars at Lakeside and 500 at Hilltop. How many cars does the model put at Lakeside on Wednesday morning, two days later?
2c. The split that stops changing
Keep multiplying and watch the state vector. Start the bike share with all 100 bikes at Riverside and multiply by once per night.
| Night | Riverside | Downtown |
|---|---|---|
| 0 | 100.00 | 0.00 |
| 1 | 80.00 | 20.00 |
| 2 | 70.00 | 30.00 |
| 3 | 65.00 | 35.00 |
| 4 | 62.50 | 37.50 |
| 5 | 61.25 | 38.75 |
| 10 | 60.04 | 39.96 |
The counts close in on 60 and 40. That split is the steady state, a distribution between the states that does not change from one step to the next. One multiplication shows it:
So there are two jobs. For a model like this one, you can predict the steady state by multiplying many times (on a calculator, try ) until the vector stops moving. To test a split someone hands you, multiply by once: it is the steady state only if the same split comes back. For this bike share, starting with all 100 at Downtown instead reaches the same 60 and 40.
Quick check · Decide and justify
A gym has 800 members, each on a monthly plan or an annual plan. Each year, 30% of monthly members switch to annual and 10% of annual members switch to monthly. With monthly first, . Is 300 monthly and 500 annual members the steady state?
Which reason supports your answer?
2d. Running the model backward
If , multiply both sides on the left by and you get . The inverse takes the model one step into the past.
For the bike share, , which is not 0, so
Suppose tomorrow's counts are 55 and 45. Then
which is tonight's 50 and 50, as it should be. Going back steps multiplies by times. Two nights before is , which is 50 and 50 again.
Multiplying today's vector by runs the model forward, whatever date is on the counts. The direction of the step picks the matrix: to go later, to go earlier.
Quick check · Spot the error
Two internet providers, Fastlink and Clearwave, share 9,000 households. Each year 10% of Fastlink's households switch to Clearwave and 20% of Clearwave's switch to Fastlink. With Fastlink first, . This year Fastlink has 5,300 households and Clearwave has 3,700. A student finds last year's counts. Tap the first line that goes wrong.
Part 3 Watch it done Last month's subscribers
Watch each step, then do the last one yourself.
A streaming service has 9,000 subscribers on two plans. Each month, 5% of Basic subscribers upgrade to Premium and 20% of Premium subscribers drop to Basic; everyone else stays on the same plan. This month there are 6,300 Basic and 2,700 Premium subscribers. How many were on each plan last month?
Step 1 · Build the model
List Basic first. Column 1 is where Basic subscribers go: 0.95 stay and 0.05 upgrade. Column 2 is where Premium subscribers go: 0.20 drop to Basic and 0.80 stay. So , and this month's vector is .
Step 2 · Pick the direction
Last month's vector, call it , satisfies . Multiply both sides on the left by : .
Why this step?
Why not multiply this month's vector by ?
takes a month to the month after it, so is next month's prediction. To step back a month you need the matrix that undoes .
Step 3 · Find the inverse
, which is not 0. Swap 0.95 and 0.80, change the signs of 0.20 and 0.05, and divide by 0.75: .
Your step · Calculate
Finish it. With and this month's vector (Basic, then Premium), how many Basic subscribers were there last month?
Row 2 gives Premium: . Last month had 6,000 Basic and 3,000 Premium, still 9,000 in all. Run it forward to check: , this month's numbers.
Part 4 Try it Driving or transit, year by year
A city planner models 80 thousand commuters who either drive or take transit. Each year, 5% of drivers switch to transit and 15% of transit riders switch to driving; the rest keep the same habit. In year 0, 50 thousand drive and 30 thousand take transit. The planner ran the model on a computer, and part of its output is in the table. Work on paper; a calculator is fine for the arithmetic.
| Year | Drive | Transit |
|---|---|---|
| 0 | 50.00 | 30.00 |
| 1 | 52.00 | 28.00 |
| 3 | 54.88 | 25.12 |
| 5 | 56.72 | 23.28 |
| 10 | 58.93 | 21.07 |
| 20 | 59.88 | 20.12 |
| 40 | 60.00 | 20.00 |
Try it · Calculate
Each year, 5% of a city's drivers switch to transit and 15% of its transit riders switch to driving. In year 3, the model has 54.88 thousand commuters driving and 25.12 thousand taking transit. To one decimal place, how many thousand commuters does the model say take transit in year 4?
Try it · Fill the statement
Each year, 5% of a city's drivers switch to transit and 15% of its transit riders switch to driving, among 80 thousand commuters. The model's output for years 10, 20 and 40 is 58.93, 59.88 and 60.00 thousand drivers, with 21.07, 20.12 and 20.00 thousand transit riders. Tap a blank, then tap an answer.
The model settles at a steady state of thousand drivers and thousand transit riders. At that split, thousand people switch from driving to transit each year, and just as many switch the other way.
Part 5 Explain it Model it in writing
Nothing you type leaves this page. Check your answer against the model and each point on the list.
Unit 4 is not on the AP Exam, so this is written practice for the course.
Written practice
A town has 7,000 households that shop at one of two grocery stores, Marlow's and FreshCo. Each year, 25% of Marlow's households switch to FreshCo and 10% of FreshCo's households switch to Marlow's; the rest stay. This year 3,040 households shop at Marlow's and 3,960 at FreshCo.
(i) Construct a matrix that models the yearly transitions, with Marlow's first, and use it to determine the numbers for next year.
(ii) Determine the numbers for last year. Explain which matrix you multiplied by and why.
(iii) A manager claims that 2,000 households at Marlow's and 5,000 at FreshCo is the steady state. Justify whether the claim is correct.
Model answer
(i) Column 1 is Marlow's households, 0.75 staying and 0.25 leaving; column 2 is FreshCo's, 0.10 leaving for Marlow's and 0.90 staying. So . Next year is : 2,676 at Marlow's and 4,324 at FreshCo. (ii) moves the model forward a year, so going back a year uses . , so and : 3,600 at Marlow's and 3,400 at FreshCo. (iii) The claim is correct. , so this split does not change from one year to the next.
Score your own answer. This is a self-check, not a grade. Tick each point your answer makes.
Part 6 Check yourself Two coffee shops
The three case questions use the same table of weekly habits. Answer them from it.
Two coffee shops, Maple and Harbor, share 400 regular customers, and each regular buys coffee at one of them each week. The table gives the percent of each shop's regulars who come back the next week and the percent who switch. This week, 252 regulars go to Maple and 148 go to Harbor. The state vector lists Maple first, and each column of the matrix that models the transitions shows where one shop's regulars go.
| Shop this week | Same shop next week | Other shop next week |
|---|---|---|
| Maple | 90% | 10% |
| Harbor | 70% | 30% |
Case question 1 · Multiple choice
The owners run the model for many weeks. Which split of the 400 regulars does it settle on?
Case question 2 · Multiple choice
With , which expression gives the state vector two weeks after this week?
Case question 3 · Calculate
According to the model, how many regulars went to Maple last week?
The rest stand on their own and do not use the case.
Check yourself · Match
A county tracks people who live in the city or in the suburbs. With the city first in the state vector, each column of shows where one group lives a year later. Tap a component, then what it means.
Check yourself · Sort it
A matrix models one step of a two-state situation, and you know one state vector. Tap a task, then the matrix you multiply the known vector by, once or more.
Part 7 Keep it Bring back earlier ideas
Pulling an older idea back up is what makes it last.
From 4.13 Matrices as Functions · Calculate
Let with and with . The transformation that applies first and then is linear. What is the component in row 1, column 2 of its matrix?
From 2.1 Change in Arithmetic and Geometric Sequences · Spot the error
A geometric sequence has and common ratio . A student finds . Tap the first line with a mistake.
In three lines
- Each column of the matrix that models the transitions shows where one state's members go in one step, as decimals, in the order of the state vector.
- gives the state vector one step later, gives it steps later, and gives it one step earlier.
- The steady state is a split that multiplying by gives back unchanged; for models like these, repeated multiplication can predict it.
Vocabulary
- State
- One of the categories a group is sorted into, such as one of two stations a bike can be parked at, with every member in exactly one state at each step.
- Transitions between states
- The moves members make from one state to another over one discrete interval, given in a context as percent changes.
- State vector
- A column vector whose components are the amounts in each state at one step, listed in the same order as the rows and columns of the matrix that models the transitions.
- Steady state
- A distribution between states that does not change from one step to the next, so the matrix that models the transitions times it gives it back.
Course alignment, for teachers
AP Precalculus topic 4.14, Unit 4: Functions Involving Parameters, Vectors, and Matrices.
- Skill 1.C: Construct new functions, using transformations, compositions, inverses, or regressions, that may be useful in modeling contexts, criteria, or data, with and without technology.
- Skill 3.B: Apply numerical results in a given mathematical or applied context.
- Skill 3.C: Support conclusions or choices with a logical rationale or appropriate data.
This lesson maps all 4 essential knowledge statements of the topic to the part that teaches each one: 4 are checked by a scored question. The map is in the lesson file.