Unit 3 · Topic 3.1 · about 30 minutes · 7 parts · 14 scored checks, 3 of them multiple choice
AP Psychology 3.1: Themes and Methods in Developmental Psychology
Unit 3: 15 to 25% of the multiple-choice section
 Tap to open the picture full size
Part 1 Think first Two ways to find out
Guess before you learn. A wrong guess still makes the answer stick.
Predict first
You want to find out whether people become more patient as they get older. Plan 1: this month, give a patience test to 200 fifteen-year-olds and 200 forty-five-year-olds. Plan 2: give the test to 200 fifteen-year-olds now, then test the same 200 people again when they are 45. Which plan tells you more about whether a person grows more patient with age?
In short. Developmental psychology studies how people change across the lifespan, organizing what it finds by age and by a few enduring themes, and it compares ages with two research designs.
- Development can be described in chronological order, age by age, or by themes that run across the whole lifespan.
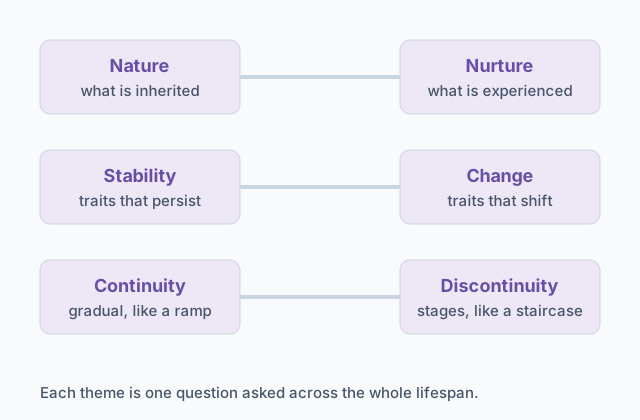
- The enduring themes are nature and nurture, stability and change, and continuity and discontinuity, which asks whether change is gradual or comes in distinct stages.
- Cross-sectional designs compare different age groups at one time, longitudinal designs follow the same people over time, and each design has its own blind spot.
Part 2 Learn it Four short ideas, each checked as you go
2a. Following a life by age, or by question
Developmental psychology studies how people grow and change from birth to old age. There are two ways to organize what it finds. One follows the chronological order of a life: infancy, then childhood, then adolescence, then adulthood, asking what usually happens at each age. The other is thematic: it picks one big question and follows it across the whole lifespan. Most textbooks, this unit included, use both.
Developmental psychologists keep coming back to three such questions, often called the enduring themes. You met the first one early in the course: nature and nurture. Nature is what a person inherits, the genes that shape their traits and the timing of their growth. Nurture is what a person experiences, from family and school to the culture they grow up in. The developmental question is how the two work together at each point in life. A child may inherit a knack for picking up language, but she still learns whichever language is spoken around her.
What makes a question a theme is that it cuts across ages. How much genes matter is a question about a newborn, a teenager and an 80-year-old alike.
Quick check · Fill the statement
Tap a blank, then tap a word.
A course that covers infancy, then childhood, then adolescence follows a approach. A course that follows one question, such as how much personality changes, from infancy to old age follows a approach. The easygoing temperament a toddler was born with is part of her , and the two languages spoken in the home where she grows up are part of her .
2b. Does it last, and does it come gradually?
The second theme is stability and change. Do the traits a person shows early on stay with them, or do people change as they grow? A shy 4-year-old could become a shy adult or an outgoing one. Research tends to find some of each: early traits carry forward to a degree, and many people still change a lot. The real question is how much, and for which traits.
The third theme is continuity and discontinuity. Continuity is the view that development is gradual, a slow build of small changes, the way a tree adds a ring each year. Discontinuity is the view that development comes in distinct steps: a sudden jump after a flat stretch, or stages where a person starts thinking or acting in a clearly different way, the way a caterpillar becomes a butterfly. The stage theories you will meet later in this unit take the discontinuous side.
These two themes ask different things. Stability and change is about whether a person keeps their traits, especially compared with other people. Continuity and discontinuity is about the shape of the path, a smooth ramp or a staircase. One study can speak to both, so read what it measured before you decide which it informs.
Quick check · Sort it
Tap a research question, then tap the theme it asks about.
Nature and nurture
Stability and change
Continuity and discontinuity
2c. Two designs for studying age
Age is the variable developmental psychologists care about most, and it is one they can never assign. Nobody can be randomly made 70. So the field relies on two designs that compare people across ages without assigning them.
A cross-sectional design compares people of different ages at one point in time. In 2026 a researcher might give the same memory task to 100 people at each of the ages 20, 40, 60 and 80, all in the same month. One round of testing, and the data are in.
A longitudinal design follows the same people over time and tests them again and again. A researcher might test 100 twenty-year-olds in 2026 and then test the same 100 people at 40, 60 and 80.
To tell them apart, ask one question about any study: were the same people tested more than once, as time passed? If yes, it is longitudinal. If different people were each tested once, in one period, it is cross-sectional. Comparing several ages does not by itself make a study longitudinal. What matters is whether the same people are followed.
Quick check · Multiple choice
In April 2026, a researcher gives the same balance test to 50 children at each of three ages, 5, 8 and 11, all at one school, and compares the three age groups. Which research design is this?
2d. What each design can show
Each design answers a different question, and each has a weak spot.
A cross-sectional study is fast and cheap, and it shows how age groups differ right now. Its weak spot is that its age groups are also cohorts, people born around the same time who grew up in the same era. In 2026 an 80-year-old and a 20-year-old differ in age, but also in the schools, technology and health care they grew up with. A gap between them may come from aging, from growing up in a different era, or from both, and the design cannot pull those apart. It also cannot show how any one person changed, because no one was tested twice.
A longitudinal study shows change and stability within the same people, such as whether curious 5-year-olds became curious adults. That makes it the design for the stability and change theme. Its weak spots are time and people. It takes years, sometimes decades, and participants move away or lose interest and drop out. If the people who leave differ from those who stay, the ones left no longer stand for the group that started. And because it follows one cohort, its results may not hold for people born in another era.
Quick check · Decide and justify
In 2026 a researcher surveyed 500 people aged 20 to 80, once each. The 70- and 80-year-olds reported far fewer video calls than the 20- and 30-year-olds. She concludes that people make fewer video calls as they get older. Does her study, on its own, support that conclusion?
Which reason supports your answer?
Part 3 Watch it done Reading a study: the design, then the theme
Watch each step, then do the last one yourself.
Illustrative study (made up for practice, not a published study). Researchers measured the length of the same 30 babies every day for four months. On most days a baby did not grow at all. Then, over a day or two, it gained about half a centimeter, and went flat again. What design is this, and which developmental theme does the finding speak to?
Step 1 · Find who was measured, and when
The same 30 babies were measured again and again over four months. The same people tested repeatedly as time passes is a longitudinal design.
Step 2 · Say what the study found
Growth did not come a little each day. It came in short bursts, with flat stretches in between.
Why this step?
Why did it matter that the same babies were measured every day?
Measured once a month, each baby would just look a bit longer each time, and growth would seem smooth. Only frequent measurements of the same babies could show whether growth arrives gradually or in jumps. Comparing babies of different ages, once each, could not show it at all.
Your step · Decide and justify
Finish the analysis. In an illustrative study, researchers measured the same 30 babies' length every day for four months. On most days a baby did not grow, then it gained about half a centimeter over a day or two and went flat again. Which developmental theme does this finding speak to most directly?
Which reason supports your answer?
Part 4 Try it Pick the design that fits the question
A design is a tool, and the research question decides which one fits. If the question is how age groups differ right now, or the answer is needed soon, a cross-sectional study can do it. If the question is whether the same people keep a trait or change, only a longitudinal study can answer it.
Try it · Sort it
Tap a research question, then the design that fits it better.
Cross-sectional design
Longitudinal design
Illustrative study (made up for practice, not a published study). One team chose the longitudinal design for the volunteering question. It enrolled 240 ninth graders in 2020 and surveyed them every year. By the 2026 survey, 168 of them were still taking part.
Try it · Calculate
In an illustrative longitudinal study, 240 ninth graders enrolled in 2020, and 168 of them were still taking part in 2026. What percent of the starting participants had dropped out by 2026?
Part 5 Explain it Write it the way the exam asks
Nothing you type leaves this page.
Free response is 33.3% of the exam score. This one is shaped like Question 1, Article Analysis Question.
Free-response practice · Question 1 style
Illustrative study (made up for practice, not a published study). Researchers wanted to know whether how sociable a child is stays stable into the teen years. In 2010 they enrolled 180 four-year-olds from preschools in one city. At ages 4, 10 and 16, each participant spent 10 minutes in a waiting room with a same-age stranger, and an observer counted how many times the participant started a conversation. By age 16, 150 participants remained. Among those 150, the 50 who had started the most conversations at age 4 were the top third. Of those 50, 31 were still in the top third at age 16. If sociability at 4 told nothing about sociability at 16, about 17 would be. The difference was statistically significant.
(A) Identify the developmental research design used in this study.
(B) State the operational definition of sociability in this study.
(C) Explain whether the results can be generalized to all children.
(D) Explain how the results support the idea of stability in development.
Model answer
(A) This is a longitudinal design.
(B) Sociability was measured as the number of times a participant started a conversation with a same-age stranger during a 10-minute wait.
(C) The results may not generalize to all children, because every participant came from preschools in one city, and children who grow up somewhere else could differ.
(D) Of the 50 children who started the most conversations at age 4, 31 were still in the top third at 16, against about 17 if age 4 told nothing about age 16. Most of the most sociable preschoolers kept their place compared with other children for twelve years, which is stability. The other 19 did change, so stability here sits alongside change.
Score your own answer. This is a self-check, not a grade. Tick each point your answer makes.
Part 6 Check yourself Two studies, two answers
On the exam, some multiple-choice questions share one set of data, the way these do.
Illustrative data (made up for practice). Two research teams used the same reasoning test, scored from 0 to 70. Study A tested 100 adults at each of five ages, 30, 40, 50, 60 and 70, once each, all in 2005. Study B tested the same 100 adults every ten years, starting in 1985 when they were 30 and ending in 2025 when they were 70.
| Age | Study A mean | Study B mean |
|---|---|---|
| 30 | 54 | 52 |
| 40 | 52 | 53 |
| 50 | 50 | 53 |
| 60 | 47 | 52 |
| 70 | 43 | 49 |
Case question 1 · Calculate
In a table of mean reasoning scores, Study A's 30-year-olds averaged 54 and its 70-year-olds 43. Study B's participants averaged 52 at age 30 and 49 at age 70. How many points larger is Study A's drop from age 30 to age 70 than Study B's drop?
Case question 2 · Multiple choice
In 2005, Study A tested 100 adults at each of five ages from 30 to 70, once each, and found an 11-point drop from age 30 to age 70. Study B followed the same 100 adults from age 30 in 1985 to age 70 in 2025 and found a 3-point drop. Which feature of Study A best explains why its drop is larger than what Study B saw within the same people?
Case question 3 · Fill the statement
Tap a blank, then a word.
Of two studies of a reasoning test, Study A tested different adults at five ages, once each, in 2005, and Study B tested one group of adults every ten years from 1985 to 2025. Study is the longitudinal study. Only it can show whether each person's score held steady with age, because it tested the people at every age.
The rest stand on their own and do not use the case.
Check yourself · Spot the error
Researchers followed the same 300 children, all born in 2010, and tested their math skills every two years from age 6 to age 16. A student writes up what the study can show. Tap the first line that goes wrong.
Check yourself · Match
Tap a term, then tap the finding that fits it.
Part 7 Keep it Bring back earlier ideas
Coming back to older ideas is how they stay usable on the exam.
Bring it back · Multiple choice
A researcher gives a new 20-item curiosity questionnaire to the same 60 teens twice, two weeks apart, and each teen's two scores come out nearly the same. This result is evidence of the questionnaire's
Bring it back · Fill the statement
Tap a blank, then a word.
In an adoption study, a researcher compares adopted children with their parents, who passed on their genes, and with their parents, who raised them. If the children's scores on a trait resemble the scores of the parents who raised them more closely, that points to the influence of .
In three lines
- Development can be studied age by age or through themes that run across the lifespan: nature and nurture, stability and change, and continuity and discontinuity.
- A cross-sectional design compares different age groups at one time; a longitudinal design follows the same people as they age.
- Cross-sectional gaps can reflect the era each cohort grew up in, while longitudinal studies take years, lose participants and follow only one cohort.
Vocabulary
- Developmental psychology
- The study of development across the lifespan, both in chronological order and through thematic issues.
- Chronological order of development
- Describing development in the order it happens, age by age.
- Nature and nurture
- The theme asking how heredity and environmental factors work together to shape development.
- Stability and change
- The theme asking whether traits persist across the lifespan or change.
- Continuous and discontinuous stages
- The theme asking whether development is gradual and continuous or moves through distinct stages.
- Cross-sectional design
- A research design that compares people of different ages at one point in time.
- Longitudinal design
- A research design that follows the same people and tests them repeatedly over time.
Course alignment, for teachers
AP Psychology topic 3.1, Unit 3: Development and Learning.
- Skill 1.A: Apply psychological perspectives, theories, concepts, and research findings to a scenario.
- Skill 2.A: Determine the type of research design(s) used in a given study.
This lesson maps the one essential knowledge statement of the topic, and the one learning objective with none of its own, to the part that teaches each one: 2 are checked by a scored question. The map is in the lesson file.