Unit 4 · Topic 4.3 · about 30 minutes · 7 parts · 9 scored checks, 2 of them multiple choice, plus 2 from earlier lessons
AP U.S. Government and Politics 4.3: Changes in Ideology
Unit 4: 10 to 15% of the multiple-choice section
What you'll be able to do
- Explain how social factors impact political ideology.
Key vocabulary
| Term | What it means | The exam trap |
|---|---|---|
| Political ideology | A connected set of beliefs about government and public policy. | One issue preference does not fully describe an ideology. |
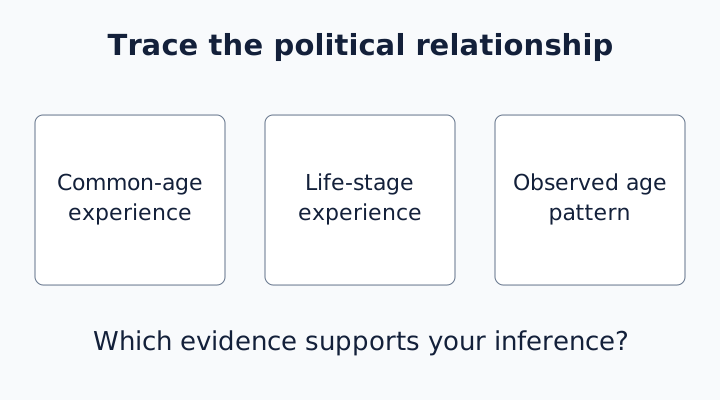
| Generational effect | An influence associated with shared experiences of people of a common age. | A generation’s average does not describe every member. |
| Life cycle effect | An influence associated with experiences at different stages of life. | Age is not evidence of a universal ideological direction. |
| Cross-sectional survey | A survey comparing people or groups at one point in time. | Different people at different ages are not one person followed over time. |
 Tap to open the picture full size
Part 1 Think first Predict the institutional consequence
Describe the pattern before explaining what may have produced it.
Predict first
A one-time survey finds that older respondents support a policy more often. Does that prove every young respondent will become more supportive with age?
In short. Generational experiences and experiences at different life stages can shape political ideology, but an age difference alone cannot distinguish those effects.
- Generational effects involve shared formative experience.
- Life cycle effects involve stage-specific experience.
- A one-time age comparison does not prove individual change.
Part 2 Learn it Shared experiences can mark a generation
2a. Shared experiences can mark a generation
A generational effect arises from experiences shared by people of a common age. People reaching political awareness during the same crisis or movement can carry similar reference points into later political life. That shared experience can contribute to ideology, a connected set of beliefs about government and public policy.
Common experience is not identical response. Two people in one generation can interpret a crisis differently because of family, media, or economic circumstances. Name the experience and explain the possible link to a belief instead of treating a generation’s label as a complete explanation.
For the end-of-lesson concept match, review this section together with the next two sections; the match combines their definitions.
Quick check · Fill the statement
Complete the explanation using the evidence.
A shared experience among people coming of age together suggests a effect.
2b. Life stages introduce new concerns
A life cycle effect comes from experiences a person encounters during different stages of life. Entering employment, caring for children, or retiring can change the policy questions that feel immediate. A person who begins caring for an older relative might pay more attention to health programs. The mechanism is the life experience and its effect on priorities.
Life cycle effects do not establish a universal rule that every person moves toward one ideology with age. A shift can differ by issue, and a person can keep an earlier commitment while changing priorities. Distinguish a change in concern from a complete replacement of ideology.
Quick check · Fill the statement
Complete the explanation using the evidence.
A person reconsidering policy while entering retirement illustrates a possible effect.
2c. Read age patterns without inventing a cause
A cross-sectional survey compares different age groups at one point in time. If older respondents support a proposal more often than younger respondents, the table shows an age pattern. It does not show that the same people became more supportive as they aged.
Generational differences, life stage experiences, and the timing of a survey can all help explain an observed gap. Repeated observations of the same people, or evidence following birth cohorts over time, can help investigate the alternatives. In a data response, first state the direction and size of the pattern; then keep any explanation conditional on the evidence available.
Quick check · Fill the statement
Complete the explanation using the evidence.
Comparing different age groups once gives a pattern, rather than observing the same people through time.
Part 3 Watch it done Read an age gradient
Original fictional one-time poll: support for a national job-training program is 38% among ages 18-29, 46% among ages 30-49, and 57% among ages 50 and older.
Step 1 · Identify the evidence
Read the ordered age categories.
Step 2 · Connect the mechanism
Support is higher in each older group: 38%, 46%, then 57%.
Why this step?
Why does the one-time design limit an aging explanation?
The groups contain different people, so the data do not follow individuals through life stages.
Step 3 · Limit the inference
The youngest-to-oldest difference is 19 percentage points, but no individual was followed.
Your step · Decide and justify
A second original one-time poll reports support at 45% for ages 18-29, 54% for ages 30-49, and 49% for ages 50 and older. How does its age pattern differ from the worked example?
Which explanation supports this inference?
A contrasting worked example
Contrasting example: Researchers follow the same respondents before and after retirement and ask about changed priorities. This design observes individual change more directly, although retirement can coincide with other influences.
Part 4 Try it Classify the institutional action
Original teaching situations: distinguish what each institution can do.
Try it · Sort it
Classify each situation by the feature it directly describes.
Generational mechanism
Life cycle mechanism
Pattern without identified mechanism
| Age group | Support |
|---|---|
| 18-29 | 38% |
| 30-49 | 46% |
| 50 and older | 57% |
Part 5 Explain it Describe a trend without overstating it
Free response is 50% of the exam score. This one is shaped like Question 2, Quantitative Analysis.
Free-response practice · Question 2 style
Use the fictional age table above. Describe the pattern across all three groups. Calculate the oldest-to-youngest gap in percentage points. Explain why the table cannot determine whether generational or life cycle effects produced the pattern. Describe one additional observation that would help investigate either explanation. Hint for the gap: subtract the youngest group’s percentage from the oldest group’s percentage; report percentage points. Also explain how becoming a caregiver could change a person’s priority concerning public health services, without assuming that everyone responds identically.
Model answer
Support increases across the listed age groups from 38% to 46% to 57%, a 19-percentage-point gap between oldest and youngest. The survey observes different people once; it does not show their formative experiences or changes through life stages. Following the same people through retirement would help investigate a life cycle explanation, while records of shared formative experiences would help investigate a generational explanation. Becoming a caregiver can make access to public health services more immediate, leading a person to prioritize those services as a life cycle effect. The experience can change priorities without determining the response of every caregiver.
Score your own answer. This is a self-check, not a grade. Tick each point your answer makes.
Part 6 Check yourself Read the evidence, then test the claim
Original fictional cross-sectional poll conducted at one time. Each age group contains 400 respondents. The proposal is a national job-training program.
| Age group | Support |
|---|---|
| 18-29 | 38% |
| 30-49 | 46% |
| 50 and older | 57% |
Case question 1 · Multiple choice
Which statement accurately describes the observed pattern?
Case question 2 · Multiple choice
Which added evidence most directly supports a generational explanation?
The rest stand on their own and do not use the case.
Check yourself · Spot the error
Select the statement that makes an institutional error.
Check yourself · Match
Match the concept to its defining feature.
Part 7 Keep it Retrieve and connect
From 1.1 Ideals of Democracy · Fill the statement
Complete the distinction between rights and the source of public power.
Rights people possess apart from government permission are . The principle that public authority comes from the people is .
From 2.1 Congress: The Senate and the House of Representatives · Fill the statement
Apply the representation rule.
The House uses representation, while the Senate gives states representation.
In three lines
- Generational effects involve shared formative experience.
- Life cycle effects involve stage-specific experience.
- A one-time age comparison does not prove individual change.
Exam strategy for this topic
- Section I, Multiple Choice: 55 questions in 80 minutes.
- Section II, Free Response: 4 questions in 100 minutes.
- This lesson's Explain it is shaped like free-response question 2, Quantitative Analysis.
Describe the pattern before explaining what may have produced it.
Questions students ask
Are generational and life cycle effects mutually exclusive?
No. A person can carry formative experiences while encountering new life-stage concerns.
Does age determine ideology?
No. Age patterns describe groups and do not establish a fixed result for each person.
Can a person change one policy view without changing an entire ideology?
Yes. Issue priorities and positions can change unevenly.
What does a one-time age table establish?
It establishes the measured differences among respondents at that time, subject to the survey’s limits. It does not by itself explain the differences.
Course alignment, for teachers
AP U.S. Government and Politics topic 4.3, Unit 4: American Political Ideologies and Beliefs.
- Skill 3.B: Describe patterns and trends in data.
This lesson maps the one essential knowledge statement of the topic to the part that teaches each one: 1 is checked by a scored question. The map is in the lesson file.