Unit 3 · Topic 3.8 · about 30 minutes · 7 parts · 11 scored checks, 2 of them multiple choice, plus 2 from earlier lessons
AP Macroeconomics 3.8: Fiscal Policy
Unit 3: 17 to 27% of the multiple-choice section
What you'll be able to do
- Define fiscal policy and the terms that go with it, then explain, using a graph where it helps, and calculate the short-run effects of a fiscal policy action.
- Explain why discretionary fiscal policy acts with lags.
Key vocabulary
| Term | What it means | The exam trap |
|---|---|---|
| Fiscal policy | A government's use of its spending and its taxes and transfers to move aggregate demand toward macroeconomic goals such as full employment. | Central bank changes to interest rates are monetary policy, not fiscal policy; fiscal policy is only the government's own spending, taxes and transfers. |
| Government spending | Government purchases of goods and services, a component of aggregate demand that a change in policy moves directly. | Purchases count in full in the first round, so $10 billion of new rail cars with an MPC of 0.8 can raise AD by up to $50 billion. |
| Taxes and transfers | Money taken from households (taxes) or paid to them with nothing bought in return (transfers), which change aggregate demand indirectly through disposable income. | Transfers are not purchases: a rise in unemployment compensation reaches AD through disposable income and takes the tax multiplier, just like a tax cut. |
| Government spending multiplier | The number that turns a change in government purchases into the largest resulting change in aggregate demand, 1 / (1 - MPC). | Dividing the gap by this multiplier, not multiplying, gives the purchase needed: a $45 billion recessionary gap with an MPC of 0.6 needs $18 billion more in purchases. |
| Tax multiplier | The number that turns a change in taxes into the resulting change in aggregate demand, MPC / (1 - MPC), smaller than the spending multiplier. | Exactly one less than the spending multiplier, so with an MPC of 0.9 it is 9, and a $36 billion inflationary gap needs a $4 billion tax increase. |
| Expansionary and contractionary fiscal policy | Policy that raises aggregate demand to close a negative (recessionary) gap, or lowers it to close a positive (inflationary) gap. | Unemployment below the natural rate calls for contractionary policy, not more stimulus, because output is already above YF. |
| Discretionary fiscal policy | Fiscal policy that lawmakers choose and enact on purpose, such as a new spending bill or a tax cut, rather than changes that happen on their own. | Rules already in law that pay more benefits as layoffs spread are automatic stabilizers; discretionary policy needs lawmakers to choose it and vote for it. |
| Lags | The delay before discretionary fiscal policy affects the economy, caused by the time it takes to decide on and implement a policy action. | Lags come from the time it takes to decide on and carry out a policy, not from the size of the multiplier or from wages adjusting. |
 Tap to open the picture full size
Part 1 Think first Approved in September, spent when?
Guess before you learn. A wrong guess still makes the answer stick.
Predict first
Unemployment in Brennick starts rising in March. In September, after months of debate, lawmakers approve $50 billion for new roads and bridges to fight the slump. When is most of that $50 billion actually spent?
In short. Fiscal policy is a government changing its spending, taxes or transfer payments to move aggregate demand, and with it real output, employment and the price level, toward full employment.
- A negative (recessionary) gap calls for expansionary policy and a positive (inflationary) gap calls for contractionary policy.
- To size the change, divide the output gap by the multiplier for the tool being used, and say whether it is an increase or a decrease.
- Discretionary fiscal policy acts with lags, because deciding on a policy and carrying it out both take time.
Part 2 Learn it Four short ideas, each checked as you go
2a. The tools and which way to use them
Fiscal policy is a government changing its spending, its taxes or its transfer payments to steer the economy. The goal this topic is about is full employment: real output at full-employment output (YF), with unemployment at its natural rate.
There are two kinds of tools. Government spending means buying goods and services: new trains, teachers' salaries, a courthouse. Taxes and transfers move money between the government and households. A transfer payment, such as unemployment compensation or a pension, is paid out with nothing bought in return.
The output gap from 3.5 Equilibrium in the Aggregate Demand–Aggregate Supply (AD–AS) Model tells you which way to use them:
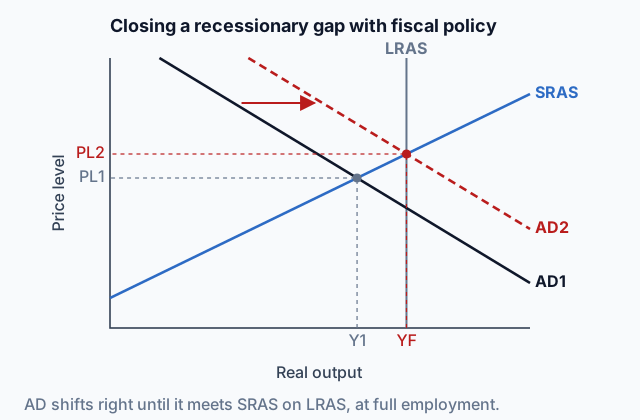
- A negative (recessionary) gap, real output below YF, calls for expansionary fiscal policy: raise government spending, cut taxes or raise transfers. Each shifts aggregate demand right.
- A positive (inflationary) gap, real output above YF, calls for contractionary fiscal policy: cut spending, raise taxes or cut transfers. Each shifts AD left.
A gap can arrive in jobs instead of dollars: unemployment of 7 percent against a natural rate of 5 percent is a recessionary gap. And a central bank changing interest rates is monetary policy (Unit 4), not fiscal policy.
Quick check · Sort it
Tap an event, then tap the kind of policy it is.
Expansionary fiscal policy
Contractionary fiscal policy
Not fiscal policy
2b. Direct and indirect: why a dollar of purchases goes further
Government spending is one of the four components of aggregate demand. When the government buys $10 billion of rail cars, that $10 billion is spending on the country's output the moment it happens. Its effect on AD is direct.
Taxes and transfers work indirectly. A $10 billion tax cut, or $10 billion more in transfer payments, raises households' disposable income by $10 billion. Households then decide how much of it to spend. With a marginal propensity to consume (MPC) of 0.8, consumption rises by $8 billion in the first round and $2 billion is saved.
After that first round, both ripple through the economy the way 3.2 Multipliers showed:
- spending (expenditure) multiplier = 1 / (1 - MPC)
- tax multiplier = MPC / (1 - MPC), which also applies to transfers
With an MPC of 0.8 those are 5 and 4. The tax multiplier is always exactly one less, because the first round of a tax change has already been cut down to MPC times its size. So the government spending multiplier is greater than the tax multiplier, and a dollar of purchases moves AD further than a dollar of tax cuts or transfers.
Quick check · Match
In an economy where the marginal propensity to consume is 0.75, tap each item, then tap its value.
2c. Fiscal policy on the AD-AS graph
Fiscal policy moves aggregate demand, and through it real output, employment and the price level. On the AD-AS graph:
- Draw the gap: axes labeled Price level and Real output, AD1 crossing SRAS at PL1 and Y1, and a vertical LRAS labeled YF on the side the gap puts it.
- Shift AD the way the policy pushes it, label the new curve AD2, and draw an arrow from AD1 to AD2.
- A policy sized to close the gap moves AD just far enough that AD2 crosses SRAS on LRAS. Mark PL2 and the new output, which is now YF, on the axes.
Expansionary policy raises real output to YF, brings unemployment down to its natural rate and raises the price level. Contractionary policy, below, lowers real output to YF and lowers the price level. SRAS and LRAS stay put: the policy changes spending, not production costs or what the economy can produce at full employment.
Contractionary fiscal policy closes a positive gap
AD shifts left from AD1 to AD2 and meets SRAS on LRAS. Output falls from Y1 to Y2, which is full-employment output (YF), and the price level falls from PL1 to PL2.
Quick check · Spot the error
A student showed a recession being fought with larger transfer payments, sized to close the gap, on an AD-AS graph. Tap the first line with a mistake.
2d. Why fiscal policy arrives late
Everything so far is discretionary fiscal policy: lawmakers choose it and vote on it. It works with lags, because deciding on a policy takes time and carrying it out takes more.
The 2007 to 2009 recession in the United States shows both. The National Bureau of Economic Research (NBER), which dates U.S. recessions, later placed the start in December 2007. It did not announce that until December 1, 2008, but Congress had not waited. The Economic Stimulus Act of 2008, approved February 13, 2008, came quickly, and it was built mainly around one round of tax rebates: up to $600 per adult, plus $300 per child. The much larger American Recovery and Reinvestment Act, with money for highways, schools and aid to the unemployed, was approved February 17, 2009, 14 months after the recession began. NBER later dated the end to June 2009.
Approval does not end the wait. Rebates have to be sent, and a highway project has to be planned, bid and built before its spending reaches aggregate demand. If the money arrives after the economy has begun to recover, it can push output past full employment instead of back to it.
Sources: NBER business cycle dating committee announcements (nber.org); govinfo.gov, Public Laws 110-185, 111-5 and 116-136; all read October 14, 2026.
Quick check · Multiple choice
Which of these is a reason discretionary fiscal policy acts with a lag?
Part 3 Watch it done Sizing a spending increase
Watch each step, then do the last one yourself.
Tarsen's real GDP is $735 billion and its full-employment real GDP is $780 billion. Its marginal propensity to consume is 0.6. The government will close the gap by changing its purchases of goods and services. Find the minimum change in government purchases.
Step 1 · Read the gap
Full-employment real GDP is $780 billion and real GDP is $735 billion, so real GDP is $45 billion below full employment. That is a negative (recessionary) gap of $45 billion.
Step 2 · Pick the multiplier
The tool is government purchases. A purchase is itself spending on the country's output, so it works through the spending multiplier, 1 / (1 - MPC), not the tax multiplier.
Why this step?
Why the spending multiplier and not the tax multiplier?
The tax multiplier is for changes that reach AD through disposable income, where households save part of each dollar before any of it is spent. A purchase skips that step: every dollar of it is spending on output in the first round.
Your step · Calculate
Finish it. Tarsen's real GDP is $735 billion, its full-employment real GDP is $780 billion and its MPC is 0.6. What is the minimum change in government purchases that closes the gap, in billions of dollars? Give a positive number for an increase and a negative number for a decrease.
billion dollars
Part 4 Try it Draw it, then size a tax change
Now with taxes. Work the next one on paper. The steps are the same as in Watch it done, with two changes: the gap may be positive, and taxes use the tax multiplier.
Try it · Calculate
Stonebridge's real GDP is $1,236 billion and its full-employment real GDP is $1,200 billion. Its marginal propensity to consume is 0.9. The government will close the gap by changing taxes alone. What is the minimum change in taxes, in billions of dollars? Give a positive number for a tax increase and a negative number for a tax cut.
Part 5 Explain it Write it the way the exam asks
Nothing you type leaves this page.
Free response is 33.35% of the exam score. This one is shaped like Question 1, Long.
Free-response practice · Question 1 style
Calvria's real GDP is $640 billion, and its full-employment real GDP is $600 billion. Its marginal propensity to consume is 0.8. (a) Draw a correctly labeled graph of aggregate demand and aggregate supply showing each of the following: (i) the current equilibrium price level, labeled PL1, and real output, labeled Y1; (ii) full-employment output, labeled YF. (b) The government will change its purchases of goods and services to close the output gap. (i) Calculate the minimum change in government purchases needed. Show your work. (ii) On your graph in part (a), show the effect of the change in part (b)(i), labeling the new price level PL2. (c) Suppose instead that the government changed taxes by the same dollar amount as your answer in part (b)(i), in the direction that closes the gap. Would the change in aggregate demand be larger than, smaller than, or the same as the change in part (b)? Explain.
Model answer
(a) Price level on the vertical axis and real output on the horizontal. AD1 slopes down and SRAS slopes up, crossing at PL1 and Y1, both marked on the axes. LRAS is vertical at YF, to the left of Y1, because real GDP of $640 billion is above full-employment real GDP of $600 billion. (b)(i) The gap is $40 billion above full employment, so AD must fall by $40 billion. The spending multiplier is 1 / (1 - 0.8) = 5, so government purchases must decrease by $40 billion / 5 = $8 billion. (ii) AD shifts left from AD1 to AD2, shown by an arrow, until AD2 crosses SRAS on LRAS at YF. PL2 is below PL1. (c) Smaller. Households pay part of an $8 billion tax increase out of money they would have saved, so their consumption falls by only 0.8 times $8 billion in the first round. The tax multiplier, 0.8 / 0.2 = 4, is smaller than the spending multiplier of 5, so AD falls by $32 billion instead of $40 billion.
Score your own answer. This is a self-check, not a grade. Tick each point your answer makes.
Part 6 Check yourself Read the timelines, then the policy
Read the timelines first, then answer both questions from them.
The National Bureau of Economic Research (NBER) dates U.S. recessions from a peak month, when a recession begins, to a trough month, when it ends, and announces each date after the fact. The two timelines set those dates beside three of the federal fiscal laws approved during the recessions. The Economic Stimulus Act of 2008 sent tax rebates. The American Recovery and Reinvestment Act of 2009 (the Recovery Act) paid for highway work, schools and aid to the unemployed. The CARES Act of 2020 sent payments to households and added to unemployment benefits.
A law's money still goes out after it is approved. The 2008 act told the Treasury to pay its rebates as rapidly as possible and no later than December 31, 2008. Much of the Recovery Act paid for projects that had to be planned and contracted before any of the money was spent.
| Date | Event |
|---|---|
| December 2007 | Recession begins (peak month) |
| February 13, 2008 | Economic Stimulus Act approved |
| December 1, 2008 | NBER announces the December 2007 peak |
| February 17, 2009 | Recovery Act approved |
| June 2009 | Recession ends (trough month) |
| September 20, 2010 | NBER announces the June 2009 trough |
| Date | Event |
|---|---|
| February 2020 | Recession begins (peak month) |
| March 27, 2020 | CARES Act approved |
| April 2020 | Recession ends (trough month) |
| June 8, 2020 | NBER announces the February 2020 peak |
| July 19, 2021 | NBER announces the April 2020 trough |
Sources: NBER business cycle dating committee announcements (nber.org); govinfo.gov, Public Laws 110-185, 111-5 and 116-136; all read October 14, 2026.
Case question 1 · Multiple choice
Using the timelines of the 2007 to 2009 and 2020 U.S. recessions, which statement about deciding on fiscal policy do they support?
Case question 2 · Sort it
Tap each delay from the 2007 to 2009 and 2020 U.S. recession timelines, then tap the part of the fiscal policy lag it belongs to.
Deciding on the policy
Carrying out the policy
The rest stand on their own and do not use the case.
Check yourself · Put it in order
During a recession, a government increases unemployment compensation, the benefit paid to people who have lost their jobs. Tap the steps that follow in the order they happen.
Check yourself · Decide and justify
In Sorrel, the unemployment rate is 3.1 percent, the natural rate of unemployment is 4.6 percent, and prices are rising quickly. Which kind of fiscal policy should Sorrel's government use?
Which reason supports your choice?
Check yourself · Select all
Pellmar's real GDP is above full-employment output. Its government cuts its purchases of goods and services by just enough to close the gap. Which two of these happen in the short run? Select two.
Select 2 answers, then check.
Part 7 Keep it Keep it
From 3.7 Long-Run Self-Adjustment · Put it in order
Household spending drops sharply, and the economy falls into a recession. No policy action is taken. Tap the steps in the order they happen.
From 3.5 Equilibrium in the Aggregate Demand–Aggregate Supply (AD–AS) Model · Decide and justify
Pravia's cyclical unemployment rate is 3%. On Pravia's AD-AS graph, where should LRAS be drawn compared with Y1, Pravia's current real output?
Which reason supports your choice?
In three lines
- Recessionary gap: raise spending, cut taxes or raise transfers; inflationary gap: the reverse.
- Spending moves AD directly; taxes and transfers move it through disposable income, so their multiplier is smaller.
- Change needed = gap divided by the multiplier, with its direction; discretionary policy arrives with a lag.
Exam strategy for this topic
- Section I, Multiple Choice: 60 questions in 70 minutes.
- Section II, Free Response: 3 questions in 60 minutes.
- This lesson's Explain it is shaped like free-response question 1, Long.
- A four-function calculator is allowed on both sections of the exam.
Show a multiplier calculation in steps: the gap, the multiplier worked out from the MPC, then the gap divided by the multiplier, and say in words whether the change is an increase or a decrease. On the graph, shift only AD and mark where AD2 crosses SRAS, with PL2 on the axis.
Questions students ask
Why does a dollar of government purchases move AD more than a dollar of tax cut?
A purchase is spending on output the moment it happens. A tax cut raises disposable income, and households save part of it first. With an MPC of 0.8, the spending multiplier is 5 and the tax multiplier is 4.
Are unemployment benefits government spending?
Not in aggregate demand. They are transfer payments: the government buys nothing with them, so they work through disposable income and use the tax multiplier.
How do I find the tax change that closes a gap?
Divide the gap by the tax multiplier and pick the direction. If real GDP is $1,236 billion, full employment is $1,200 billion and the MPC is 0.9, the tax multiplier is 9, so taxes rise by $36 billion ÷ 9 = $4 billion.
Why does fiscal policy arrive late?
Lawmakers have to agree on a policy, and then it has to be carried out. The U.S. Recovery Act became law 14 months after the recession that began in December 2007, and many of its highway projects still had to be planned and built before the money was spent.
Is a central bank cutting interest rates fiscal policy?
No. That is monetary policy, which comes in Unit 4.
Course alignment, for teachers
AP Macroeconomics topic 3.8, Unit 3: National Income and Price Determination.
- Skill 2.A: Using economic concepts, principles, or models, explain how a specific economic outcome occurs or what action should be taken in order to achieve a specific economic outcome.
This lesson maps all 8 essential knowledge statements of the topic to the part that teaches each one: 8 are checked by a scored question. The map is in the lesson file.