Unit 4 · Topic 4.1 · about 30 minutes · 7 parts · 13 scored checks, 1 of them multiple choice
AP Precalculus 4.1: Parametric Functions
Not assessed on the AP Exam. Unit 4 is part of the course, but nothing in it is on the exam.
 Tap to open the picture full size
Part 1 Think first A drone over a field
Guess before you read on. A wrong guess still helps the right answer stick.
Predict first
During a 4-second test flight, a drone's position seconds in is meters east of a fence post and meters north of it, for . Seen from above, what shape is its path?
In short. A parametric function uses one independent variable, the parameter , to give both coordinates of a point in the plane.
- To make a table of values, choose several values of in the domain and evaluate both and at each one.
- To sketch the graph, join the points from the table in order of increasing , which is often not the order from left to right.
- When the domain is restricted, as in , the graph has a start point at the least value of and an end point at the greatest.
Part 2 Learn it Four short ideas, each checked before the next
2a. Two equations, one input
Until now, has depended on . A parametric function works differently. Both and depend on a third variable, , called the parameter. You get two parametric equations, one for each coordinate:
Here and are the names of two functions, and is the one independent variable they share. Put in one value of and you get one and one , which make an ordered pair. So the two equations act as a single function:
Its outputs are points in , the set of all ordered pairs of two real numbers. For example, .
A point on its own does not show you . Looking at on a graph, nothing tells you it came from . You keep track of yourself.
Quick check · Fill the statement
The parametric function is . Tap a blank, then tap an answer.
The single independent variable of is , called the parameter. In , the letters and are names of two of it. The output is the point .
2b. A table of values
To see what a parametric function draws, build a table. Choose several values of in the domain, and evaluate both and at each one. For with domain , the whole numbers give five rows.
| Point | |||
|---|---|---|---|
Be careful with negative values of . When , is 4, not , so and .
Two rows have , and two have . That is fine. Each of and is a function of , and nothing requires each to go with only one . Put both ends of the domain in your table. You will need them in a moment.
Quick check · Calculate
The parametric function is . What is the -coordinate of the point ?
2c. Join the points in order of t
To sketch the graph, plot the points from the table and connect them in order of increasing . Not left to right, and not bottom to top. The order is set by .
For that order is , then , , and . The curve swings right, turns at , and comes back left while it climbs. Small arrows along a sketch show the way increases.
Join the same five points from left to right instead, and you get to to and so on. That zigzag is not the graph of .
More rows, such as or , show more of where the curve bends. They never change the rule: every point goes between the points for the values of just below and just above its own.
Quick check · Put it in order
The parametric function has domain , and its graph passes through each of these five points once. Tap them in the order a sketch joins them.
2d. Where the graph starts and stops
The domain of a parametric function is often restricted, like . Then the graph does not go on forever. It has a start point, at the least value of , and an end point, at the greatest.
For on , the start point is and the end point is . The start point is not the lowest point of the graph, and it is not . It is wherever begins.
Change the domain and the ends move. On the same function starts at , ends at , and draws only the middle of the curve. In a sketch, mark both ends and stop the curve there.
Quick check · Multiple choice
The parametric function has domain . What are the start point and the end point of its graph?
Part 3 Watch it done From a formula to a sketch
Read each step, then do the last one yourself.
Build a table of values for on the domain , using the whole numbers and , and sketch its graph.
Step 1 · Choose values of t
The domain runs from to 2, so take the whole numbers . That includes both ends. The extra row for goes between the rows for and , where the curve bends.
Step 2 · Evaluate x(t)
gives 3, 0, , 0 and 3 at the whole numbers. The two negative values of give the same as their positive partners, because squaring removes the sign. The extra row has .
Step 3 · Evaluate y(t)
. A cube keeps its sign: , , , and . So the whole-number rows give the points , , , and .
Why this step?
When the points are joined, why does the sketch go from to , and not straight down to , the point directly below it?
comes from . The next value of is 0, which gives . The point comes from , two steps later, so the path reaches it only after passing through . Sharing an -coordinate says nothing about the order.
Your step · Calculate
Finish it. One cell is left in the table of : the -coordinate in the row for , where . What is ? Give a decimal.
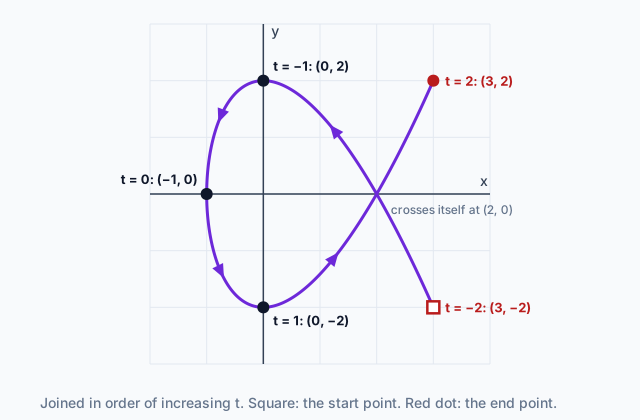
Now join the six points in order of . Start at , where . Go to , then , then , then , and end at , where . The path climbs to the left, loops round through , dips through the new point, and then heads right and up, crossing its own earlier stretch on the positive -axis.
The row for never changes the order rule. It slots in by its value of and shows more of where the curve bends. The diagram on this page is this same graph, with the start point marked by a square and the end point by a red dot.
Part 4 Try it Move the ends of a graph
Warm up in the lab first. It graphs the parametric function with and . The top graph is the path in the plane, and the two below it are against and against .
Now a new function, on paper. Make your own table for with domain , using the whole numbers from 0 to 4. Then answer the two questions.
Try it · Calculate
The parametric function has domain . If the domain is stretched to , what is the -coordinate of the new end point of its graph?
Try it · Decide and justify
For on , a table at gives the points , , , and . Mia sketches the graph of by joining those points from left to right. Is her sketch the graph of ?
Which reason supports your answer?
Part 5 Explain it Put it in writing
Nothing you type leaves this page. Compare your answer with the model and tick off each point on the list.
Unit 4 is not on the AP Exam, so this is written practice for the course.
Written practice
The parametric function is given by for . (i) Construct a table of values for at and 3. (ii) Identify the start point and the end point of the graph of , and explain how you know which is which. (iii) Describe how to sketch the graph of from your table.
Model answer
(i) : . : . : . : . : . (ii) The start point is and the end point is . The domain runs from to , the start point comes from the least value of and the end point from the greatest. (iii) Plot the five points and join them in order of increasing : to to to to . The path moves left, turns at and comes back right, so joining the points from left to right would draw a different picture. The graph begins at and stops at , because the domain is restricted.
Score your own answer. This is a self-check, not a grade. Tick each point your answer makes.
Part 6 Check yourself A robot vacuum on a grid
The two case questions use the same robot. Answer them from its formulas and table.
A robot vacuum cleans a room. Its position seconds after it starts is , in meters from the room's west wall and south wall, where and , for . The table gives four of its positions.
| (seconds) | ||
|---|---|---|
Case question 1 · Calculate
The robot vacuum's position is for . What is the -coordinate of ?
Case question 2 · Select all
The robot vacuum's position is for . Which two statements about the graph of are true? Pick two.
Select 2 answers, then check.
The rest stand on their own and do not use the case.
Check yourself · Spot the error
A student finds the point of for . Tap the first line that goes wrong.
Check yourself · Sort it
Each card describes one letter in a parametric function . Tap a card, then tap the letter it describes.
The parameter
or
Part 7 Keep it Bring back earlier ideas
Pulling an older idea back up is what makes it last.
From 3.15 Rates of Change in Polar Functions · Spot the error
A polar function has and . A student finds the average rate of change of with respect to from to . Tap the first line that goes wrong.
Work this one on paper. A graphing app plots , and the curve looks like an ordinary sine wave, only taller and shifted. The sine sum identity says why. Expand :
So for every . Use that form to read off what the first form hides.
From 3.12 Equivalent Representations of Trigonometric Functions · Calculate
The function is equal to for every . What is the greatest value of ?
In three lines
- A parametric function gives both coordinates from one independent variable, the parameter .
- A table of values evaluates and at several values of , and the sketch joins those points in order of increasing .
- A restricted domain gives the graph a start point at the least value of and an end point at the greatest.
Vocabulary
- Parametric function
- A function in that gives the two dependent variables and from a single independent variable .
- Parametric equations
- The two equations of a parametric function, one for and one for .
- Parameter
- The single independent variable that both and depend on.
- Numerical table of values
- A table made by evaluating and at several values within the domain.
- Start and end points
- The points of the graph at the least and greatest values of , which exist when the domain of is restricted.
Course alignment, for teachers
AP Precalculus topic 4.1, Unit 4: Functions Involving Parameters, Vectors, and Matrices.
- Skill 1.A: Solve equations and inequalities represented analytically, with and without technology.
- Skill 2.B: Construct equivalent graphical, numerical, analytical, and verbal representations of functions that are useful in a given mathematical or applied context, with and without technology.
This lesson maps all 5 essential knowledge statements of the topic to the part that teaches each one: 5 are checked by a scored question. The map is in the lesson file.