Unit 4 · Topic 4.3 · about 30 minutes · 7 parts · 14 scored checks, 3 of them multiple choice
AP Precalculus 4.3: Parametric Functions and Rates of Change
Not assessed on the AP Exam. Unit 4 is part of the course, but nothing in it is on the exam.
 Tap to open the picture full size
Part 1 Think first Two walks, one map
Commit to a guess first. Being wrong now still helps the answer stick.
Predict first
Maya and Theo each walk once around the loop trail at a park. Their phone apps draw each route on a map, and the two drawings are identical, line for line. Does that mean they walked the loop the same way?
In short. For a parametric function , the direction of motion as increases and the average rates of change both come from looking at and one at a time.
- Where increases the point moves right and where it decreases the point moves left; where increases the point moves up and where it decreases the point moves down.
- A path can pass one point at two values of moving two different ways, and one curve can be parametrized many ways, traced in either direction.
- Over , the average rate of change of divided by the average rate of change of is the slope between the two points, as long as the rate of is not 0.
Part 2 Learn it Four short ideas, each checked before the next
2a. Read x and y one at a time
A parametric function gives the position of a moving point as . To tell which way the point moves as increases, you do not need the picture. Look at the two coordinates separately.
- If is increasing, the point moves right. If is decreasing, it moves left.
- If is increasing, the point moves up. If is decreasing, it moves down.
Then put the two together. A beetle on graph paper at for has , which decreases, and , which increases when . It crawls left and up the whole time.
A coordinate can turn around partway through. Take and on . The graph of against is a parabola with its vertex at , so decreases on and increases on . Meanwhile increases the whole time. The point moves left and up, then right and up. Split the interval wherever either coordinate changes direction.
Quick check · Match
Each parametric function is given on an interval of . Tap a function, then the way its point moves as increases.
2b. One point, two directions
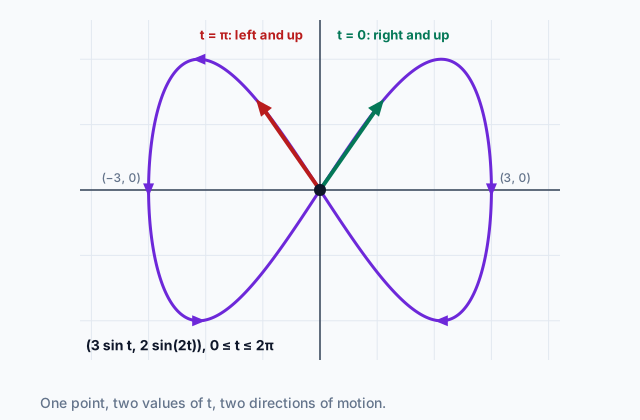
A path can pass through the same point more than once, and it does not have to be going the same way each time. The path for is the figure eight in the diagram. It is at the origin when and again when .
Check each visit on a short interval of , using what you know about sine.
On , increases, so increases. The angle runs from 0 to , where sine increases, so increases too. The point leaves the origin moving right and up.
On , decreases, so decreases. The angle runs from to , where sine increases, so increases. This time the point leaves the origin moving left and up.
One point, two directions. So when you are asked which way a particle moves at a point, you need the value of , not only the point.
Quick check · Multiple choice
A particle moves along for . It is at the origin when and when . Which describes its motion on and on ?
2c. One curve, many parametric functions
Back to the two walkers. Their maps matched, but their walks did not have to. The same curve in the plane can be parametrized in different ways, and different parametric functions can trace it in different directions.
Each of these traces the piece of from to :
- for . Here increases, so the point goes left to right.
- for . Here , so again, and runs from to 2 while increasing. Left to right again, over a shorter interval of .
- for . Here decreases, so the point starts at and goes right to left.
When the curve is the graph of a function like , and each only increases or only decreases, the check is short. Show that both parametric functions satisfy and cover the same stretch of ; then they draw the same piece. Compare directions by whether each increases or decreases. For other curves, such as a circle, check that both give the same set of points, then compare directions interval by interval. A curve drawn without arrows cannot tell you.
Quick check · Decide and justify
Compare and , each for . Which is true?
Which reason supports your answer?
2d. Average rates of change and the slope between two points
Over an interval , each coordinate has its own average rate of change, worked out the way you did in Unit 1:
Take on . The points are and . The average rate of change of is and the average rate of change of is , each in units per unit of .
Divide the rate of by the rate of : . That is the slope of the line through and , because the in both denominators cancels and leaves .
This only works when the average rate of change of is not 0. On from to , starts and ends at 0, so its average rate of change is 0. The points and sit one straight above the other, and the slope between them is not defined. The point did move sideways in between, left and then right. An average rate of change sees only the two ends.
Quick check · Calculate
A particle moves along . Use the average rates of change of and over to find the slope of the graph between the points where and .
Part 3 Watch it done From two values of t to a slope
Read each step, then do the last one yourself.
A particle moves along . Use average rates of change to find the slope of its graph between the points where and .
Step 1 · Find the two points
At : and , so the point is . At : and , so the point is .
Step 2 · Average rate of change of x
units per unit of . It is not 0, so the slope between the points exists.
Why this step?
Why check the average rate of change of before dividing by it?
The slope is the rate of divided by the rate of . If the rate of were 0, the two points would have the same -coordinate, one straight above the other, and there would be no number to divide by. The slope between them would not be defined.
Step 3 · Change in y
From to , goes from to 9, a change of , over the same 2 units of .
Your step · Calculate
Finish it. For the particle at , the average rate of change of over is 4, and changes by 14 over that interval. What is the slope of the graph between the points where and ?
The slope is positive, but the particle did not climb the whole way. Near , dips to about before rising to 9. The slope between the end points describes the straight line from start to finish, not every moment in between.
Part 4 Try it The same oval, the other way round
The lab shows and for , an oval 4 units wide and 6 units tall, centered at the origin. The readouts are off, so you read the graphs. The two questions after the lab are about a different parametrization of the same oval, , which starts at the top and which the lab does not draw.
Try it · Put it in order
A point moves along for , starting at . Tap these points in the order the point reaches them.
Try it · Calculate
A point moves along . Use the average rates of change of and over to find the slope of the graph between the points where and .
Part 5 Explain it Write it out
Nothing you type leaves this page. Check your answer against the model and each point on the list.
Unit 4 is not on the AP Exam, so this is written practice for the course.
Written practice
A particle moves in the plane with and for . (i) Describe the direction of motion on and on , and explain how you know. (ii) Find the average rates of change of and of over , and use them to find the slope of the graph between the points where and . (iii) Explain why the same method gives no slope between the points where and .
Model answer
(i) The graph of against is a parabola opening up with its vertex at , so decreases on and increases on . decreases the whole time. So the particle moves left and down on , then right and down on . (ii) , , and . The average rate of change of is and of is . The slope between and is . (iii) , so the average rate of change of over is 0, and the ratio would divide by 0. The points and lie one straight above the other, so the slope between them is not defined.
Score your own answer. This is a self-check, not a grade. Tick each point your answer makes.
Part 6 Check yourself A warehouse robot
The three case questions use the same table. Answer them from it.
A robot R carries boxes across a warehouse floor. Its position at time seconds is , in meters from one corner of the floor. Between consecutive times in the table, each coordinate changes steadily in one direction.
| (seconds) | (meters) | (meters) |
|---|---|---|
Case question 1 · Fill the statement
The robot R is at the point at and again at . Tap a blank, then tap a direction.
As R leaves at , it moves . As R leaves at , it moves .
Case question 2 · Calculate
Use the average rates of change of and over to find the slope of the line through the robot R's positions at and .
Case question 3 · Multiple choice
What is the slope of the line through the robot R's positions at and , found from the average rates of change over ?
The rest stand on their own and do not use the case.
Check yourself · Spot the error
A student finds the slope of the graph of between the points where and . Tap the first line that goes wrong.
Check yourself · Sort it
Each parametric function traces the part of from to . Tap a card, then tap which way its point moves as increases.
Starts at and moves right
Starts at and moves left
Part 7 Keep it From earlier lessons
Pulling an older idea back up is what makes it last.
From 4.1 Parametric Functions · Multiple choice
The parametric function has domain . What are the start point and the end point of its graph?
From 1.3 Rates of Change in Linear and Quadratic Functions · Calculate
Let . What is the slope of the secant line through and ?
In three lines
- As increases, increasing means right and decreasing means left; increasing means up and decreasing means down.
- A path can pass one point moving different ways at different values of , and one curve can be parametrized many ways, in either direction.
- The average rate of change of over that of is the slope between the two points, unless the rate of is 0.
Vocabulary
- Parametric function
- A function that gives a point in the plane for each value of the parameter .
- Parameter
- The single independent variable that both and depend on.
- Planar motion
- Motion of a particle in the plane, whose direction as increases is right or left as increases or decreases, and up or down as increases or decreases.
- Average rate of change
- Over , for and for ; their ratio, over , is the slope between the two points when the rate of is not 0.
Course alignment, for teachers
AP Precalculus topic 4.3, Unit 4: Functions Involving Parameters, Vectors, and Matrices.
- Skill 3.B: Apply numerical results in a given mathematical or applied context.
- Skill 3.C: Support conclusions or choices with a logical rationale or appropriate data.
This lesson maps all 4 essential knowledge statements of the topic to the part that teaches each one: 4 are checked by a scored question. The map is in the lesson file.