Unit 4 · Topic 4.5 · about 30 minutes · 7 parts · 13 scored checks, 2 of them multiple choice
AP Precalculus 4.5: Implicitly Defined Functions
Not assessed on the AP Exam. Unit 4 is part of the course, but nothing in it is on the exam.
 Tap to open the picture full size
Part 1 Think first The ladder slides
Commit to a guess first. Being wrong now still helps the answer stick.
Predict first
A 13-foot ladder leans against a wall. Its foot is 5 feet from the wall and its top is 12 feet up the wall. You pull the foot 1 foot farther out, to 6 feet. How far does the top of the ladder slide down the wall?
In short. An equation involving two variables, such as , can describe functions without being solved for either variable, and its graph is every ordered pair that makes it true.
- Solving the equation for one variable can define one or more functions, each with a graph that is part or all of the graph of the equation: gives the top half of that circle.
- For two ordered pairs on the graph that are close together, a positive ratio of the changes means and increase together or decrease together, and a negative ratio means one increases as the other decreases.
- Where the change in over the change in between nearby points shrinks to 0, the graph is horizontal; where the change in over the change in shrinks to 0, the graph is vertical.
Part 2 Learn it Four short ideas, each checked before the next
2a. An equation draws its own graph
Most equations you have graphed came solved for , like . Put in , get one . The ladder gave you instead, with neither variable on its own side.
An ordered pair is on the graph of an equation when it makes the equation true. Take . The pair works, since . So does , because is also 16. The pair does not: is 32.
To graph the equation, find solutions. Pick a value of and solve for every that goes with it.
| or | |
| or | |
| or | |
| or | |
| or | |
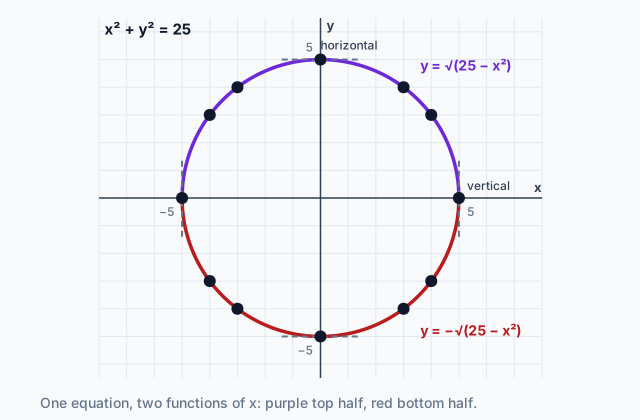
Plot those twelve points and join them, and you get the circle in the diagram: radius 5, centered at the origin. You could just as well have picked values of and solved for . The equation does not care which variable you start from, so start from whichever one makes the arithmetic easy.
Notice that gave you two values of . Hold on to that.
Quick check · Sort it
Each card is an ordered pair . Tap a card, then tap whether it is a solution of .
On the graph
Not on the graph
2b. One equation, more than one function
The vertical line meets the circle twice, at and . So on the whole graph, is not a function of . The equation still describes functions. It does so implicitly, without handing you a formula.
Solve for to get them out:
Each of these is a function on . The first has outputs of 0 or more, so its graph is the top half of the circle. The second is the bottom half. Neither one is the whole graph, and together they are all of it.
Solve for instead and you get two functions of : is the right half and is the left half.
Sometimes solving gives the whole graph at once. becomes , one function whose graph is the entire line. Part or all depends on how many values of one variable go with each value of the other.
Quick check · Match
Each function comes from solving for one of its variables. Tap a function, then the part of the graph of the equation that it gives.
2c. How x and y move together
Take two ordered pairs on the graph that are close together. Divide the change in by the change in , subtracting both in the same order. The sign tells you how the two variables vary together there:
- Positive: and increase together, or decrease together.
- Negative: as one increases, the other decreases.
Try it on , whose graph opens to the right. The points and are both on it, since . The change in is 0.1 and the change in is 0.41, a ratio of about 0.24. It is positive, so on the top half and grow together.
Now take and on the bottom half. The change in is , so the ratio is about . As increases, decreases.
Same equation, opposite answers. That is normal, so always say where on the graph you are. On the circle the ratio is negative near and positive near . The ladder lives where it is negative: pull the foot out and the top comes down.
Quick check · Multiple choice
The points and are on the graph of an equation in and , close together. What is the sign of the ratio of the change in to the change in between them, and what does it tell you?
2d. When one change is zero
On the circle , start at the top, , and step right to nearby points. To the change in over the change in is about . To it is about . Step left instead and you get about and . The closer the point, the closer the ratio gets to 0, from both sides. So the rate of change of with respect to is 0 at , and the graph is horizontal there.
Two points at the same height are not enough. and share a height on the circle. The graph of comes to a sharp corner at : the ratio to every nearby point is exactly on the right and 1 on the left, so it never shrinks.
For vertical, flip the ratio. Near , the change in over the change in is about to and to . So the rate of change of with respect to is 0 there, and the graph is vertical. Where one of these rates is exactly 0 along a whole stretch, that stretch is a horizontal or vertical interval.
Quick check · Fill the statement
The graph of passes through and . Tap a blank, then tap an answer.
From , the change in over the change in is about to and about to , and the points on the left give the same sizes with the opposite sign. As the points get closer, the ratio shrinks toward , so the graph is at . Near , going up to moves by but by only about , and going up to moves by but by only . So here it is the rate of change of with respect to that behaves like the first ratio, and the graph is at .
Part 3 Watch it done From an equation to two functions
Read each step, then do the last one yourself.
The equation relates and . Graph it from its solutions, write the functions of it describes, and decide how and vary together on the bottom half of the graph.
Step 1 · Find solutions
Here it is easier to pick and compute . Then gives , gives and , gives and , and gives and . Plotted and joined, they make a curve that opens to the left with its tip at .
Step 2 · Solve for y
, so or , each for . The first gives the top half of the graph and the second gives the bottom half.
Why this step?
Why does this equation describe two functions of but only one function of ?
Each gives exactly one , since , so is a function of on the whole graph. Each below 16 goes with two values of , one positive and one negative. A function gives only one output, so the graph splits into two functions of .
Step 3 · Pick two nearby points
On the bottom half, take and . Then and , so the points are and .
Your step · Calculate
Finish it. The points and are both on the graph of . What is the ratio of the change in to the change in between them?
On the top half the ratio has the opposite sign: there falls toward 0 as moves right. At the tip , flip the ratio. The change in over the change in is to and to , shrinking toward 0 as the points get closer, so the graph is vertical at .
Part 4 Try it Plot a curve on its side
You need paper for this one. Take the equation . It is already solved for , so pick values of and compute . Here are nine solutions.
Draw axes from to 3 both ways, with across and up. Plot the nine points and join them in order of , from the bottom of the table to the top. You should get an S shape lying on its side. Then answer the two questions.
Try it · Calculate
How many points of the graph of have ?
Try it · Decide and justify
Over the whole graph of , which statement is true?
Which reason supports your answer?
Part 5 Explain it Write it out
Nothing you type leaves this page. Check your answer against the model and each point on the list.
Unit 4 is not on the AP Exam, so this is written practice for the course.
Written practice
The equation relates and . (i) Identify the two points of its graph with . (ii) Solve the equation for , and describe the part of the graph that each resulting function gives. (iii) The points and are on the graph, close together. Describe how and vary together between them, using the ratio of their changes. (iv) The points and are on the graph near , and so are and . Find the change in over the change in from to each of the first two points, and explain what the ratios show about the graph at .
Model answer
(i) With , , so and the points are and . (ii) , so or , for . The first has outputs of 0 or more and gives the top half of the graph. The second gives the bottom half. Together they are all of it. (iii) The change in is and the change in is , so the ratio is about . It is negative, so decreases as increases between these points. (iv) To the ratio is , and to it is . Below the axis the same sizes come with the opposite sign. The ratio shrinks toward 0 as the points get closer, so the rate of change of with respect to is 0 at and the graph is vertical there.
Score your own answer. This is a self-check, not a grade. Tick each point your answer makes.
Part 6 Check yourself Gates with a diagonal brace
The two case questions use the same table. Answer them from it.
A carpenter builds rectangular gates, each braced by one diagonal board that is exactly 50 inches long. A gate inches wide and inches tall needs , by the Pythagorean theorem. The table lists four gate shapes that fit.
| Width (inches) | Height (inches) |
|---|---|
| 14 | 48 |
| 30 | 40 |
| 40 | 30 |
| 48 | 14 |
Case question 1 · Multiple choice
For these gates, the height is a function of the width. Which function gives the height , in inches, of a gate that is inches wide?
Case question 2 · Calculate
Using the gates that are 40 and 48 inches wide, what is the ratio of the change in height to the change in width?
The rest stand on their own and do not use the case.
Check yourself · Spot the error
A student decides how the graph of looks at the point . Tap the first line that goes wrong.
Check yourself · Sketch the graph
Every rectangle with an area of 60 square centimeters has a width and a length , in centimeters, that make true. Sketch the part of the graph of for widths from 1 to 5 centimeters. The first point is fixed at .
One shape that fits
Drag a point up or down, or tap it and use the arrow keys. Only the shape is checked.
Part 7 Keep it From earlier lessons
Pulling an older idea back up is what makes it last.
From 3.15 Rates of Change in Polar Functions · Calculate
A polar function has and , with in radians. What is the average rate of change of with respect to from to ?
From 3.12 Equivalent Representations of Trigonometric Functions · Calculate
An angle has and . What is ? Give a decimal.
In three lines
- An equation in two variables is graphed from its solutions: pick a value of one variable and solve for every value of the other.
- Solving for one variable can give one or more functions, each with a graph that is part or all of the graph of the equation.
- Between nearby points, the sign of the change in over the change in says how they vary together; where that ratio shrinks to 0 the graph is horizontal, and where its flip shrinks to 0 it is vertical.
Vocabulary
- Implicitly defined function
- A function described by an equation involving two variables rather than by its own formula, such as the top half of the graph of , which solving gives as .
- Ordered pairs
- Pairs that make an equation true; together they form the graph of the equation.
- Rate of change of y with respect to x
- The change in divided by the change in between two nearby points; where it shrinks to 0, the graph is horizontal.
- Rate of change of x with respect to y
- The change in divided by the change in between two nearby points; where it shrinks to 0, the graph is vertical.
Course alignment, for teachers
AP Precalculus topic 4.5, Unit 4: Functions Involving Parameters, Vectors, and Matrices.
- Skill 2.B: Construct equivalent graphical, numerical, analytical, and verbal representations of functions that are useful in a given mathematical or applied context, with and without technology.
- Skill 3.A: Describe the characteristics of a function with varying levels of precision, depending on the function representation and available mathematical tools.
This lesson maps all 5 essential knowledge statements of the topic to the part that teaches each one: 5 are checked by a scored question. The map is in the lesson file.