Unit 4 · Topic 4.6 · about 30 minutes · 7 parts · 9 scored checks, 2 of them multiple choice, plus 2 from earlier lessons
AP U.S. Government and Politics 4.6: Evaluating Public Opinion Data
Unit 4: 10 to 15% of the multiple-choice section
What you'll be able to do
- Explain the quality and credibility of claims based on public opinion data.
Key vocabulary
| Term | What it means | The exam trap |
|---|---|---|
| Public opinion | The distribution of people’s views about public issues or political actors. | A distribution is not a binding instruction to an officeholder. |
| Reliability | The dependability of a measurement and its method. | A familiar sponsor does not substitute for disclosed methods. |
| Veracity | Truthfulness of reported data and claims. | An accurate number can accompany an overstated conclusion. |
| Truncated axis | An axis displaying only part of a possible numerical range. | Read the tick values before judging apparent size. |
| Percentage point | A unit for the difference between two percentages. | A point difference is different from a proportional percent change. |
 Tap to open the picture full size
Part 1 Think first Predict the institutional consequence
Explain what opinion could influence while keeping the claim within the method and visual limits.
Predict first
A chart makes 52% support look twice as tall as 50% support. What should you inspect first?
In short. Public opinion can influence elections and policy debates, but credible political claims must fit the poll’s population, method, uncertainty, and evidence.
- Public opinion shapes political incentives.
- Credibility depends on method and truthful reporting.
- Visual encoding can exaggerate a real but small difference.
Part 2 Learn it Opinion is an influence, not an instruction
2a. Opinion is an influence, not an instruction
Politicians, campaigns, and organized groups use public opinion to judge which issues matter and how citizens evaluate proposals. A credible poll showing broad concern can encourage officials to prioritize a problem. In an election, perceived support can affect strategy and resource allocation.
Polls do not cast votes, enact statutes, or bind representatives to one policy. Issue intensity, participation, institutions, and competing goals also affect outcomes. Explain what a poll could imply for incentives without claiming it dictates the final action. Public opinion matters as a source of political influence even when a proposal does not become law.
For the end-of-lesson concept match, review this section together with the next two sections; the match combines their definitions.
Quick check · Fill the statement
Complete the explanation using the evidence.
A campaign uses survey evidence to decide where to focus advertising. This is a change in . The certified tally of votes records the .
2b. Evaluate reliability and veracity
Reliability concerns whether the measure and method provide dependable evidence. Veracity concerns the truthfulness of the data and the claims made from them. Ask who was sampled, what they were asked, when the work occurred, what uncertainty is reported, and whether the conclusion matches those limits. A fabricated table or a selective report of only favorable responses undermines credibility even if it looks professional.
A poll of city transit users supports claims about that sampled population more directly than claims about all state voters. A small gap between estimates should be discussed with sampling uncertainty in view. Agreement with your own preference is not a methodological test.
Quick check · Fill the statement
Complete the explanation using the evidence.
A survey of people using city buses samples the population. To estimate views among the statewide voting electorate, the target population is .
2c. A picture can exaggerate a real difference
A chart can display true numbers in a misleading way. A truncated axis can make a small percentage-point change occupy most of the plotting area. Missing uncertainty bars can make close estimates appear more distinct than the evidence warrants. The first limitation concerns visual encoding; the second concerns what uncertainty the display omits.
A poll reporting 51% support with a sampling margin of plus or minus 3 points does not establish a clear population majority under that simple interval. A chart can correctly label 51% while a headline exaggerates its certainty. Evaluate the underlying data and the visual representation separately, then state what political inference remains reasonable.
Quick check · Fill the statement
Complete the explanation using the evidence.
A chart beginning its support axis at 48% uses a axis; it can exaggerate the apparent between 50% and 52%.
Part 3 Watch it done Separate influence from certainty
Original fictional state poll reports 51% support for a transit bond, a margin of error of plus or minus 3 points, and a probability sample of 900 state adults. A separate original fictional display of comparable 50% and 52% support estimates uses bars beginning at a 48% baseline.
Step 1 · Identify the evidence
Read the estimate and simple interval: 48% to 54%.
Step 2 · Connect the mechanism
The result could encourage an official to investigate the proposal’s support.
Why this step?
Why keep the adult sample separate from the electorate?
Some sampled adults will not vote, so their views cannot simply be treated as future vote shares.
Step 3 · Limit the inference
The interval includes values below half, and adults are not the same as eventual voters.
Your step · Decide and justify
New condition: the same poll values are redrawn on a clearly labeled 0%-100% axis, without any new respondents. Which improvement follows?
Which explanation supports this inference?
A contrasting worked example
Contrasting example: A council receives a petition from 200 transit advocates. The petition demonstrates participation and intensity among signers; it does not estimate the support share among all residents.
Part 4 Try it Classify the institutional action
Original independent report examples for classification. The city report is a separate stipulated report; it is not a row from the later state-adult tracking table.
Try it · Sort it
Classify each situation by the feature it directly describes.
Supported description
Overstated political conclusion
Visual-encoding problem
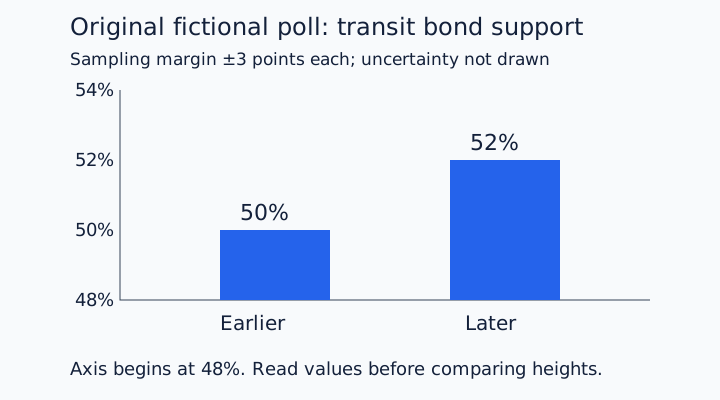
Original fictional visual: bars begin at 48%, not zero. Earlier support is 50%; later support is 52%. Each poll has n = 900 state adults and a reported sampling margin of plus or minus 3 points.
Part 5 Explain it Explain influence and a visual limitation
Free response is 50% of the exam score. This one is shaped like Question 2, Quantitative Analysis.
Free-response practice · Question 2 style
Use the original chart displayed just above. Identify the numerical change from earlier to later support. Explain how the chart’s 48% baseline affects the apparent size of that change. Explain what the poll might imply for an official’s incentives. Explain why the data do not establish a guaranteed election outcome. Hint: subtract the earlier percentage from the later percentage and use percentage points.
Model answer
Support increases from 50% to 52%, a 2-percentage-point difference. The bars begin at 48%, so their visible heights are 2 and 4 points; that makes a small difference look like a doubling. An official could use the measured support to prioritize the issue, but the reported uncertainty and state-adult population prevent a guarantee about the actual voting electorate.
Score your own answer. This is a self-check, not a grade. Tick each point your answer makes.
Part 6 Check yourself Read the evidence, then test the claim
Original fictional comparable state-adult probability polls; n = 900 in each wave. Reported sampling margin is plus or minus 3 points. No election outcome is observed.
| Wave | Transit bond support |
|---|---|
| Earlier | 50% |
| Later | 52% |
Case question 1 · Multiple choice
Which visual choice would exaggerate the apparent change between these estimates?
Case question 2 · Multiple choice
What political implication is reasonable?
The rest stand on their own and do not use the case.
Check yourself · Spot the error
Select the statement that makes an institutional error.
Check yourself · Match
Match the concept to its defining feature.
Part 7 Keep it Retrieve and connect
From 1.1 Ideals of Democracy · Fill the statement
Complete the distinction between rights and the source of public power.
Rights people possess apart from government permission are . The principle that public authority comes from the people is .
From 2.1 Congress: The Senate and the House of Representatives · Fill the statement
Apply the representation rule.
The House uses representation, while the Senate gives states representation.
In three lines
- Public opinion shapes political incentives.
- Credibility depends on method and truthful reporting.
- Visual encoding can exaggerate a real but small difference.
Exam strategy for this topic
- Section I, Multiple Choice: 55 questions in 80 minutes.
- Section II, Free Response: 4 questions in 100 minutes.
- This lesson's Explain it is shaped like free-response question 2, Quantitative Analysis.
Explain what opinion could influence while keeping the claim within the method and visual limits.
Questions students ask
Can a credible poll be politically influential without predicting the winner?
Yes. It can identify concerns or support that affect strategy while leaving turnout and later events unresolved.
Is a truncated axis always fraudulent?
No. It can reveal small changes if clearly explained, but it can exaggerate their practical size when readers compare bar heights.
Is sampling error the same as a misleading chart?
No. Sampling uncertainty concerns estimates from a sample; misleading scale concerns the display of values.
Why distinguish adults from voters?
The people eligible or available to respond are not necessarily the people who will participate in an election.
Course alignment, for teachers
AP U.S. Government and Politics topic 4.6, Unit 4: American Political Ideologies and Beliefs.
- Skill 3.D: Explain what the data implies or illustrates about political principles, institutions, processes, policies, and behaviors.
This lesson maps the one essential knowledge statement of the topic to the part that teaches each one: 1 is checked by a scored question. The map is in the lesson file.