Unit 5 · Topic 5.2 · about 30 minutes · 7 parts · 11 scored checks, 2 of them multiple choice, plus 2 from earlier lessons
AP U.S. Government and Politics 5.2: Voter Turnout
Unit 5: 20 to 27% of the multiple-choice section
What you'll be able to do
- Explain the roles that individual choice and state laws play in voter turnout in elections.
Key vocabulary
| Term | What it means | The exam trap |
|---|---|---|
| Turnout | The share of a specified population that casts a ballot. | Check the denominator before comparing percentages. |
| Political efficacy | Belief that one’s political participation can make a difference. | Confidence in influence differs from approval of an officeholder. |
| Structural barrier | An institutional condition that raises the difficulty of participation. | A formal right can coexist with practical costs. |
| Registration | The process of establishing eligibility on voter rolls. | Enrollment and casting a ballot are different stages. |
| Party identification | A person’s attachment to a political party. | Attachment is one influence among several. |
 Tap to open the picture full size
Part 1 Think first Investigate a political mechanism
Explain a mechanism using specific evidence. A label by itself does not establish how an outcome follows.
Predict first
Two otherwise similar workers have different polling hours available: one can vote after work and the other cannot. What would you investigate about turnout?
In short. Turnout reflects voting rules, resources, engagement, and election context; group patterns do not determine individual behavior.
- Name the denominator.
- Connect access and efficacy to participation.
- Keep turnout separate from candidate preference.
Part 2 Learn it Access and motivation interact
2a. Access and motivation interact
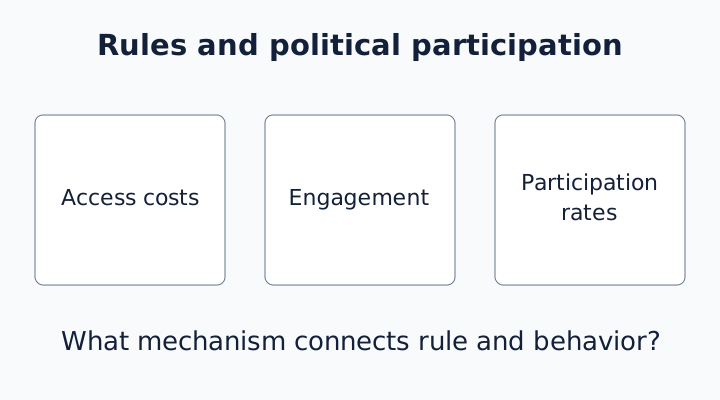
Turnout is participation among a defined population. Always name the denominator: eligible voters, registered voters, and voting-age residents are different groups. A rule can raise the time or effort needed to vote without formally removing the right. Polling hours, absentee availability, travel, and work schedules shape these costs. Political efficacy is the belief that participation can make a difference. A citizen who thinks officials ignore people like them may choose not to participate even when voting is convenient.
Demographic characteristics can help predict group differences, but they do not fix a person’s behavior. Age, education, and other characteristics can be associated with resources, engagement, and the costs of voting. Explain a possible mechanism rather than saying a demographic label causes turnout. A table showing a group average cannot tell you which particular person voted or what motivated that person.
Quick check · Fill the statement
Complete the explanation using the evidence.
A citizen who believes participation matters expresses political ; a polling place open only during work hours presents a structural .
2b. State rules and election context
States administer elections under federal constitutional and statutory constraints. Polling hours, voter identification rules, and funding for polling places and workers affect access. Mail voting, absentee voting, and early voting create different ways to cast a ballot. These options are distinct from registration: getting onto the voter rolls can involve in-person, online, or automatic processes. Compare registration requirements before assuming two states offer the same access.
Presidential elections generally attract higher turnout than midterms. Greater publicity, mobilization, and perceived stakes can help explain that pattern. This is a general pattern rather than a guarantee for every jurisdiction. A comparison between states cannot establish the isolated effect of one law if campaign competitiveness, population, and other rules also differ. State the observed difference, offer a plausible mechanism, and explain what evidence would be needed to test it.
Quick check · Fill the statement
Complete the explanation using the evidence.
Online enrollment concerns voter ; voting before election day concerns .
2c. Who votes differs from whom they choose
Demographic characteristics and political engagement help predict the likelihood of voting. Candidate choice is a separate question. Party identification and ideology can guide choices; candidate characteristics and contemporary issues can also matter. Religious belief or affiliation, age, gender, race, and ethnicity may be associated with patterns of preference without determining everyone’s decision.
In an original fictional table, older adults have higher turnout than younger adults in both election types. That pattern supports a comparison of group rates, not a claim that every older adult votes. To explain the pattern, propose mechanisms such as different levels of engagement or unequal practical barriers. To explain candidate choice, look for stated policy preferences, party attachments, candidate evaluations, or issue concerns. Do not use a turnout percentage as if it were a candidate’s vote share.
Quick check · Fill the statement
Complete the explanation using the evidence.
A group’s turnout rate predicts participation at the level. A candidate preference requires evidence about .
Part 3 Watch it done Explain a turnout pattern
Original fictional rates: younger adults, presidential 48%, midterm 32%; older adults, presidential 72%, midterm 60%. All rates use eligible adults in each group.
Step 1 · Read within each row
Both age groups have higher presidential than midterm turnout.
Why this step?
Why compare like denominators?
Different denominators can change rates without a change in participation; here each rate uses eligible adults in its age group.
Step 2 · Explain without overclaiming
Greater mobilization and salience in presidential elections are plausible explanations. The table alone does not isolate their effects.
Your step · Decide and justify
A state adds after-work voting hours, and turnout rises. Does this alone prove the rule caused the increase?
Which reason supports this new inference?
A contrasting worked example
Contrast: Two fictional states show different turnout after one offers online registration. Step 1: identify the rule difference. Step 2: explain reduced enrollment effort as a plausible mechanism. Step 3: retain competitiveness and population differences as alternative explanations; a two-state comparison alone does not prove causation.
Part 4 Try it Classify the institutional action
Original teaching situations: distinguish what each institution can do.
Try it · Sort it
Sort each example by its defining feature.
Access condition
Motivation or preference
Try it · Fill the statement
Apply the institutional distinction.
Attachment to a party is party ; a voter’s broad policy beliefs form an ideological .
Try it · Sort it
Classify the evidence each voter emphasizes when choosing a candidate.
Ideological orientation
Candidate characteristic
Contemporary issue
| Group | Presidential (%) | Midterm (%) |
|---|---|---|
| 18-29 | 48 | 32 |
| 65 and older | 72 | 60 |
Part 5 Explain it Explain the data and its limits
Free response is 50% of the exam score. This one is shaped like Question 2, Quantitative Analysis.
Free-response practice · Question 2 style
Using the fictional turnout table in Try it, (A) describe the election-type pattern, (B) explain one plausible institutional or motivational mechanism, and (C) explain why the table cannot establish candidate preference or a causal effect of age.
Model answer
Both groups have higher presidential turnout. Presidential publicity and mobilization can increase engagement, while state rules such as early voting may reduce the practical cost of participating. The table does not measure those mechanisms, so it cannot isolate their effects. It reports participation rather than vote choice; group age differences also do not determine any one person’s behavior.
Score your own answer. This is a self-check, not a grade. Tick each point your answer makes.
Part 6 Check yourself Read comparable turnout rates
Original fictional turnout data. Percentages use eligible adults in the named age group, not registered voters.
| Age group | Presidential turnout (%) | Midterm turnout (%) |
|---|---|---|
| 18-29 | 48 | 32 |
| 65 and older | 72 | 60 |
Case question 1 · Multiple choice
Which pattern appears in both rows?
Case question 2 · Multiple choice
Which explanation respects the table’s limits?
The rest stand on their own and do not use the case.
Check yourself · Spot the error
Select the statement that makes an institutional error.
Check yourself · Match
Match each concept to its defining feature.
Part 7 Keep it Retrieve and connect
From 1.5 Ratification of the U.S. Constitution · Fill the statement
Apply the distinction in the completed statement.
The Great Compromise tied House representation to and gave states representation in the Senate.
From 1.6 Principles of American Government · Fill the statement
Apply the distinction in the completed statement.
In an attributed paraphrase of Federalist No. 51, one branch’s institutional interest can restrain another through , limiting the concentration of power and possible abuse.
In three lines
- Name the denominator.
- Connect access and efficacy to participation.
- Keep turnout separate from candidate preference.
Exam strategy for this topic
- Section I, Multiple Choice: 55 questions in 80 minutes.
- Section II, Free Response: 4 questions in 100 minutes.
- This lesson's Explain it is shaped like free-response question 2, Quantitative Analysis.
Explain a mechanism using specific evidence. A label by itself does not establish how an outcome follows.
Questions students ask
Is turnout always calculated the same way?
No. Eligible population, registered voters, and voting-age population are different denominators. Compare like measures.
Does easier registration guarantee a vote?
No. Enrollment removes one obstacle; motivation and other voting costs remain.
Are demographic predictions individual facts?
No. They describe probabilities or group patterns, leaving variation among individuals.
Why does presidential turnout often exceed midterm turnout?
Presidential contests generally bring more publicity and mobilization. A specific comparison still needs evidence about its setting.
Course alignment, for teachers
AP U.S. Government and Politics topic 5.2, Unit 5: Political Participation.
- Skill 3.C: Explain patterns and trends in data to draw conclusions.
This lesson maps all 4 essential knowledge statements of the topic to the part that teaches each one: 4 are checked by a scored question. The map is in the lesson file.